
If you’re concerned about an aquatic resource threat anywhere in the USA then contact CEDS at 410-654-3021 or Help@ceds.org for an initial no-cost discussion of strategy options. In many parts of the nation, land development – housing projects, shopping centers, new highways, etc. – is the only source of aquatic resource degradation which is increasing. This degradation is caused by wetland and waterway destruction during site clearance, a dramatic increase in soil erosion and mud pollution in the construction phase, then accelerated channel erosion and stormwater runoff pollution from the completed project. According to the U.S. Environmental Protection Agency, urban stormwater runoff accounts for:
- 7% of impaired lakes;
- 9% of degraded streams and rivers; and
- 12% of our degraded tidal waters.
 Though these percentages may sound low, consider that the U.S. Census Bureau estimates that 80% of us live in suburban-urban areas. Large portions of the waters within these areas are sufficiently polluted by stormwater runoff that swimming or even wading would be unwise and many are devoid of fish and other aquatic organisms. There is likely no other source of aquatic resource degradation that robs more U.S. citizens of recreational opportunities than development related impacts. The good news is that technologies to reverse the effects of past development and gain the benefits of new development with minimal aquatic resource damage have advanced tremendously over the past couple of decades. In theory, it is now possible to develop the land with essentially no adverse effects. In reality though, few localities are requiring full use of this technology and fewer still have the inspection and enforcement programs in place to reap the benefits of the technology over a period of years, then decades. In this webpage we’ll introduce you to the:
- Scientific research documenting how development impacts aquatic resources;
- Methods to minimize these impacts on specific development sites;
- How to responsibly manage growth throughout a watershed; and
- Ensuring that inspection and maintenance programs keep our waters clean for decades to come.
WHY CLEAN WATER IS IMPORTANT
That clean water is vitally important should go without saying, but it helps sometimes to cite a few statistics. For example, the 2016 Gallup Poll found that 61% of Americans worry a great deal about clean water. A 2017 survey of things Americans fear revealed that Pollution of Oceans, Rivers and Lakes was third from the top. In addition to the Flint, Michigan water supply disaster, Americans have many other good reasons to be concerned. According to the Centers for Disease Control, 4- to 32 million U.S. cases of illness are caused annually due to consumption of water from public systems. On average, homes with a waterfront view sell for twice as much as comparable homes lacking such a view. Research has shown a positive relationship between water quality and property value at many locations throughout the nation:
- Chesapeake Bay,
- Lake Erie,
- Minnesota lakes,
- Ohio, and
- San Francisco Bay to name a few.
The latest U.S. Census showed that 80% of Americans live in suburban-urban areas. Most of the waters in these areas are degraded by stormwater pollution, sewerline leakage and other sources. This means that the waters nearest four out of five U.S. homes may be unfit for human use. We certainly would not want our children playing in these waters.
PREVENTING IMPACTS IS EASY
We assume you’re visiting this webpage because you’re concerned about how a proposed development project may impact a wetland, stream, lake or some other aquatic resource you treasure. If you are like most folks new to this form of advocacy you probably think its both difficult and expensive to prevent impacts. The good news is that its actually quite easy. And you probably don’t need a lawyer or any other professionals. The reason is that its generally easy to modify most development proposals to utilize the highly-effective aquatic resource protection measures that have come into use over the past decade. And these measures can actually save the developer money. With your support the developer is more likely to gain approval from permitting agencies to use these measures. We’ve found most development companies are anxious to work with citizens who have realistic solutions to potential impacts. We call this approach Equitable Solutions. We have a webpage devoted to the approach where you’ll find detailed advice on how to make it work for you: Equitable Solutions webpage. And when the company isn’t so anxious, the CEDS Smart Legal Strategies approach usually allows our clients to prevail.
EXAMPLE OF CEDS ANALYSIS & VICTORY
A massive commercial project was proposed along a river plagued by excessive nutrient inputs. Loadings of the key nutrient – nitrogen – under four scenarios is shown in the following graph.  The local government had allowed the project to use antiquated stormwater controls. As shown in the graph, with no stormwater pollution control this project would have dumped 827 pounds of nitrogen a year into the river. The approved control would reduce the loading to 623 pounds, which was far in excess of that needed to protect the river. With the use of highly-effective controls – Environmental Site Design (ESD) – only 287 pounds of pollution would have been released. Highly-effective controls are described later in this webpage. Initially both the developer and local government insisted that ESD would not work on the site. CEDS showed this was not true. We made this project the poster-child for poor stormwater management throughout the county. This and other actions eventually resulted in the developer agreeing to make full use of ESD. Plus this campaign raised compliance with ESD requirements from 27% to 75% countywide. For further detail see our analysis. For an example of an analysis of rezoning and annexation impacts see: Ann Arbor Report. An example of a CEDS evaluation of of how well a locality makes use of highly-effective protection measures can be found at: Montgomery County MD Environmental Site Design Audit.
HOW DEVELOPMENT IMPACTS AQUATIC RESOURCES
Converting forest and farms to houses, streets, shopping centers and parking lots can greatly increase the volume of stormwater runoff as well as the quantity of pollutants entrained in runoff. Most of the impact comes from sealing the earth with impervious surfaces: asphalt, concrete, rooftops, etc. But initial damages occur during the construction phase due to direct physical impacts such as bulldozing stream channels or filling wetlands. These early impacts also include clearing streamside and watershed forests. During the construction phase soil erosion and mud pollution can increase by ten- to a hundred-fold. Post-construction impacts include: accelerated channel erosion, loss of groundwater recharge, stormwater wash off of pollutants from lawns and impervious surfaces, discharge of heated runoff from streets and ponds, and flood damage to downstream structures. Impacts can also result from:
- poorly planned wells that can harm other groundwater users and aquatic resources;
- withdrawal of water from streams and other bodies;
- poorly planned septic systems;
- sewerlines, pumping stations and other sewage collection system components; and wastewater treatment plants.
Construction Phase Mud Pollution
Prior to 1970, land development occurred without any of the erosion and sediment control measures used today. At that time a single, 20-acre construction site could release enough eroded soil to damage three miles of downstream waters with recovery taking up to a century. Damage would result from the eroded soil (sediment) filling in wetlands, stream and river channels which made flooding worse. Boating channels lost depth. Sediment suspended in the water column would prevent light from reaching submerged aquatic vegetation. The suspended particles killed fish eggs and larvae along with other aquatic organisms. Sediment deposition can destroy habitat such as deep pools, undercut banks and riffles. The suspended sediment also caused increased heating. A large part of the pollution released from construction sites, like pesticides from disturbing crop fields, are attached to clay particles which are difficult to trap once eroded. 
Channel Erosion
As a result, watershed development causes the frequency and severity of downstream flooding to increase dramatically. In fact, converting a forest-covered watershed to homes on ¼-acre lots can cause floodwater volumes to recur annually which were seen but once a century before development. This change threatens streamside homes, bridges and other structures. The increase in floodwater flows also causes extensive stream channel erosion. As illustrated above, typically a stream channel would be scoured two- to eight-fold wider once the watershed was intensively developed. 
Groundwater Recharge & Dry-Weather Inflow
The increase in runoff comes at the expense of groundwater recharge. For example, an acre of Maryland forest typically absorbs about 250,000 gallons of precipitation per year and this water travels deep enough into the earth to recharge the groundwater system. As illustrated below, over a period of weeks to years this runoff travels beneath the earth to eventually emerge at a spring or seep where it becomes surface water again. It is this inflow that provides the water carried by a stream or river between storms. Recharge and inflow are crucial to maintaining the health of wetlands and tidal waterways. Inflowing groundwater is also exceptionally clean and dilutes the polluted runoff from developed portions of a watershed.  After passing so far through the earth this inflow has an average temperature of 55°F with a range of 37°F at the Canadian border to 77°F in south Florida (see groundwater temperature map below). As explained in the next section, this inflow is crucial to minimizing the effect of heated runoff from impervious surfaces like asphalt or from stormwater pond overflow.
Thermal Impact
Development caused excessive water temperature impacts come from three causes: release of water heated in a stormwater pond, runoff from heated impervious surfaces, and removal of streamside shading vegetation.
Ponds
While water sits in a pond it comes to the same temperature as the overlying air. During a hot summer afternoon stormwater pond water can heat to the mid- to upper 80°F range. When a thunderstorm generates runoff it displaces this heated water into a nearby waterway. 
Heated Impervious Surfaces
An asphalt parking lot can heat to 120 F° on a sunny afternoon. Runoff from the lot absorbs a large amount of this heat to reach a temperature in excess of 90°F. The heated runoff can then abruptly increase stream temperature by 12°F.
Loss of Shading Vegetation
A stream flowing from a forest, where it is heavily shaded, into a section where development has removed all shade, can exhibit a 20°F increase within the first half-mile.
Aquatic Resource Impact of Excess Temperature
Some of our most important game fish, like trout and other salmonids, perish at a temperature in excess of 72°F. It is not unusual for trout stream to have a temperature is the mid- to upper-60°F range in the summer. A 12°F increase would be lethal at that time. Additionally, a heated pond, lake, tidal waterway or sluggish river exhibit more frequent dissolved oxygen deficiencies as water temperature increases. Elevated water temperature also tends to increase the adverse effects of toxic pollutants. 
Stormwater Pollution
A tremendous quantity of air pollution settles upon rooftops, parking lots and other impervious surfaces. The pollution originates at distant coal-fired power plants and other industrial smokestacks. A large portion also comes from the vehicles we drive. Deicing salts has caused extensive ground and surface water contamination in some parts of the nation. Our pets contribute waste that washes off lawns along with the fertilizers and pesticides we apply. Lesser sources include driveway coating, metal roof gutters and downspouts, and car washing. All of these pollutants wash-off into nearby waterways with each storm that produces runoff. As a result, runoff from our homes, streets and lawns contain a tremendous amount of pollution. In many areas stormwater pollution from developed lands is the only source which is increasing. Following is a summary of the effect of common stormwater pollutants. 
Nutrients
Nitrogen and phosphorus are the primary nutrients of concern. Both are needed by algae, submerged aquatic vegetation (SAV) and other plants growing in our wetlands, streams, lakes and tidal waters. When present in excessive amounts nutrients can cause the flora of a waterway to transition from rooted plants to algae. SAV are essential habitat for fish and other aquatic organisms. The loss of SAVs can bring about a dramatic reduction in fish, shellfish and the organisms they feed upon. If left unchecked the sheer abundance of decaying algae can lower dissolved oxygen levels to the point of causing mass fish kills. It can also lead to the proliferation of Harmful Algae Blooms which release substances toxic to aquatic life, humans and our pets.
Toxics
The most common toxic pollutants present in stormwater runoff are the metals cadmium, copper, lead and zinc as well as nickel and chromium in some situations. A primary source of these metals is from motor vehicle exhaust as well as both engine and tire wear. Copper and zinc tend to be the pollutants most likely to cause a toxic effect. But when dealing with toxic pollutants one does not focus on average concentrations but the maximum likely to recur once every three years or so. This time period is based upon how frequently an aquatic community can be exposed to substances that kill without making recovery difficult.
Sediment
Once a construction site is completed, very little sediment comes from buildings, streets, parking lots or even lawns. The source of most of the sediment is from accelerated channel erosion caused by the large increase in runoff volumes (see photo below). However, it is still essential that the sediment entrained in runoff be kept out of nearby waters. This is because a sizable portion of the pollutants carried in stormwater are attached to sediment particles. For example, up to 80% of the VOCs discussed below enter waterways attached to sediment particles. 
Disease-Causing Organisms
Also known as biological pathogens, the organisms present in stormwater include those causing giardiasis, salmonellosis, infectious hepatitis, typhoid fever and cholera. In many suburban-urban area sewage from leaking or overflowing sewerlines is the source of these pathogens along with pet and wildlife wastes washed from our rooftops and lawns by stormwater. Other sources include leaking dumpsters, pools, hot tubs, along with a number of other sources where wastes from humans and other mammals may be washed into waterways. One study indicated that pathogen indicator organisms reached unsafe levels when watershed impervious area is around 15%. But a public health issue can occur at much lower development intensities. In other words, all suburban-urban waterways may contain unhealthful pathogen densities. Most homes in the nation are a few minutes walk from the nearest urban-suburban waterway. All parents know how difficult it is to keep children from playing in these nearby waters. This means our only option is to restore all waters to a child safe and friendly condition. 
Volatile Organic Compounds
VOCs in drinking water may be harmful to the nervous system, kidneys and liver. VOCs detected in stormwater runoff from impervious surfaces include compounds such as benzene, chloroform, toluene and many others. A subgroup of VOCs known as polycyclic aromatic hydrocarbons (PAHs) are the major VOCs detected in highway runoff and urban stormwater. PAHs come mostly from crankcase oil and vehicle emissions. VOCs tend to have a low direct toxicity to aquatic life, but can become a serious threat as they bioaccumulate. This is the process where the VOCs consumed by lower organisms are absorbed in their tissues then consumed and concentrated in the tissues of organisms higher link of the food chain. Eventually bioaccumulation causes harm to the higher organisms including humans.
Deicing Salts
Sodium chloride is the principle salt used to reduce road icing. Besides giving drinking water an unpleasant (salty) taste, this compound can harm human health and exert a toxic effect upon aquatic life. Salt pollutes waterways when it washes off of treated roads. It enters groundwater mostly by splashing onto roadside areas and infiltrating down through the soil column. It can also be released from poorly designed salt storage sites. The U.S. Geological Survey found salt levels above aquatic life protection standards in 40% of the urban streams sampled but only 2% of wells exceeded drinking water standards. The salt concentration in our waters has been increasing over time as we use ever greater amounts. 
Impervious Area & Aquatic Resource Damage
Beginning with a 1979 study, researchers have found a close relationship between the health of aquatic resources and the percent of a watershed covered by impervious surfaces. The table below shows the IA% at which each aquatic resource begins to show stress due to increasing watershed development.  In reality, aquatic resource impacts begin when the first house is built in a forest-covered watershed without effective control measures. But we lack measurement techniques sensitive enough to detect these early impacts. And even if development remains below these thresholds unique conditions may exist which cause impacts to be much higher than normal, like an abundance of highly-erodible soils. The table above shows that aquatic resource damage generally begins when watershed impervious area exceeds 5%. This equates to 660 feet of downstream waters degraded for each acre of impervious surface. We’ve entered into an era when most states are requiring the use of highly-effective measures to minimize the impacts of development. These new approaches are described below under Aquatic Resource Protection Methods. The new approaches offer the possibility of allowing us to reap the benefits of growth with no impact to aquatic resources. However, we will not be able to tell if the approaches really work for another 20 years or so. In the interim, it may be best to limit development in watersheds supporting high-quality waters or those with highly-regarded organisms, like game fish or threatened-endangered species, to the impervious area thresholds given above.
Impervious Area & Aquatic Resource Health
The overall health of streams, rivers and other waters is frequently rated as excellent, good, fair or poor. The following from a 2017, USEPA report noted more than half our rivers and streams were in poor condition.  The ratings are based upon samplings of the fish and macroinvertebrates (insects, worms, crayfish, snails, etc.) inhabiting a waterway. Generally the more different kinds (taxa) of these critters the healthier the waterway. Mathematical models such as the Index of Biotic Integrity are used to convert diversity and abundance into numeric ratings. These values can then be translated to the following narrative ratings:
Excellent: No limits on human uses. Can support highly sensitive fish and other aquatic life. Waters smell and look very clean.
Good: The most sensitive aquatic organisms may no longer thrive but game fish populations can be greater than in excellent quality waters. Other wise no restrictions on human uses. These waters may look a bit less clean.
Fair: Sensitive aquatic organisms have been eliminated along with most game fish. People should not swim in these waters, though wading and paddling may be okay. However, fair quality waters may not look or smell clean.
Poor: All but the most pollution tolerant fish and other organisms have been eliminated. Any direct body contact should be avoided. Extensive treatment may be needed prior to use as a public water supply.
Dead: Though this rating seldom appears in reports, it should. When impervious area exceeds 25% a waterway may become quite devoid of aquatic life.
Another rating system categorizes aquatic resource health as: Sensitive, Impacted and Non-Supporting. Sensitive is equivalent to Good or Excellent. Impacted would be Fair to Poor. And Non-Supporting waterways are mostly Dead. The following table relates percent impervious area to categories of aquatic resource health. These are general ratings, not applicable to highly-sensitive waters. 
Determining Existing & Future Imperviousness
The easiest way to determine impervious area for the waterway or water body of concern to you is to do an internet search on the name + “percent impervious”. This should reveal any publications containing this information. Local environmental planning or stormwater management staff may have the data too. If you still cannot find this information then first delineate the watershed using the procedures in the NRCS publication: How to Read a Topographic Map and Delineate a Watershed. To compute impervious area see: EPA’s Methodology to Calculate Baseline Estimates of. Impervious Area (IA) and. Directly Connected Impervious Area (DCIA). Top
Watershed Forest Cover & Streamside Buffers
Forest provides many benefits that enhance aquatic resource health. Compared to other watershed land uses, forests:
- Have the lowest volume of erosion and other runoff pollution,
- Generate the smallest volume of floodwaters,
- Provide the greatest amount of groundwater recharge and, therefore, dry-weather inflow to streams, wetlands, lakes, rivers and tidal waters, and
- The high-quality inflow from watershed forests dilutes the impact of pollution released from impervious surfaces, septic systems and other sources.
The forests bordering a stream or other aquatic resources provide additional benefits:
- Shade provided by near-channel trees keeps water temperature cool in the summer,
- The leaves, twigs and other tree material carried into waters by the wind is an essential source of the organic matter supporting aquatic ecosystems,
- Tree trunks and branches fallen into a waterway creates essential habitat for fish and other creatures,
- Trees protect channels from the erosive effects of floodwaters, and
- Floodplain forests retard floodwaters and lower the depth of inundation.
Because of the many benefits listed above, scientific research has shown that aquatic resource health is a direct reflection of the percentage of a watershed covered with forests as well as the percentage of channels with riparian (streamside) forests.  The following table shows the minimum watershed forest cover and riparian buffer needed to retain four levels of health. Excellent conditions would be needed for high-quality waters, public water supplies and those supporting highly-sensitive species like salmonids or those threatened-endangered. Good conditions are needed for most other game fish and an abundance, diverse aquatic community. Good conditions is the minimum we should accept for the waters closest to our homes where our children play.
  It is important to note that achieving these forest and buffer percentages will not result in higher quality waters unless other sources of degradation are mitigated. For example, in the suburban-urban watersheds where 80% of U.S. citizens live, runoff from all impervious surfaces must be treated with highly-effective Best Management Practices. Once this goal is achieved then reaching the forest-buffer thresholds will make it possible to attain a higher level of aquatic resource health.
Water Withdrawals
This impact category includes withdraw of water from the ground and from surface water bodies. Groundwater is the source of 37% of the water consumed in USA homes. Surface water bodies account for the other 63%. Withdraws that are most harmful are those where so much water is consumed that other users or aquatic ecosystems suffer. But many uses then return a large part of the water. For example, in New Mexico 43% of the groundwater withdrawn by a rural residential well will be returned via the septic system serving the rural home. On Cape Cod 85% of household water consumption was released into the soil through septic systems. Particularly harmful are uses that withdraw water from one watershed then discharge it in another watershed. The aquatic ecosystem impact of water withdrawals is much the same as for reduced groundwater recharge described above. Groundwater recharge comes mostly from rain or snow melt soaking beneath the root zone to reach the water table. But recharge can also come from rivers that leak into underlying groundwater systems. And artificial recharge occurs through stormwater infiltration basins, injection wells, etc. As recharge decreases due to ground or surface withdrawals less water enters wetlands, streams, lakes and tidal waters via seeps and springs. This can lead to elevated water temperature, fish and other organisms can find it harder to get past migration obstacles, habitat quality generally declines, there’s less high-quality groundwater inflow to support sensitive aquatic communities which worsens the impact of pollution releases. A proposed, rural development project may depend upon a separate, individual well for each proposed house or a central well in larger communities. Just as reduced recharge can lower groundwater supporting aquatic communities, it can also diminish the amount of water available for our use. Particularly at risk are rural homes served by wells or rural communities dependent upon a single groundwater source (aquifer). A typical rural resident uses 81 gallons of water per day. If too many homes are allowed to tap the same water source then all will suffer come the next drought. The same is true if a major new user begins withdrawing vast amounts of surface water without verifying first that existing users will not be harmed. Fortunately, most states have adopted permitting systems to ensure that a proposed water use will not harm either aquatic resources or other human users. More on this below in Preventing Water Withdraw Impacts.
Wastewater
Wastewater includes everything that comes from our toilets, sinks, showers, dishwashers and washing machines. It also includes all of the used water from our schools, businesses, industries, etc. In rural areas wastewater may be treated by discharge to the soil or into a waterway. But in suburban-urban areas it is usually piped via sewerlines and a sewage collection system to a central wastewater treatment plant. 
Wastewater Impacts
The organic matter in wastewater consumes oxygen as it is digested by bacteria and other organisms. Prior to the adoption of the Clean Water Act, it was quite common to see severe dissolved oxygen deficiencies in waters receiving excessive inflows of poorly treated waste. Today the nutrients contained in treated wastewater are more likely to cause oxygen deficiencies. Wastewater contains many disease-causing organisms. Chlorine used to disinfect treated wastewater can be toxic to many aquatic organisms. As a result alternative disinfection methods, like ultraviolet light, are coming into greater use.
Septic Systems
Wastewater from rural homes is usually discharged first to a septic tank where solids settle. The partially treated liquid flows out into a series of pipes or pits known as a drainfield. While septic systems do remove a large portion of the pollutants entrained in waster, it is far from 100%. In fact, a conventional septic system only reduces nitrogen levels by about 10%, which is why some states require additional treatment measures that can reduce nitrogen by 50%.
Sewage Collection System Releases
In recently developed areas stormwater and wastewater are carried by separate pipe systems. But in many cities combined sewers remain where sewage and stormwater mix. During mild storms the single pipe system carries all the liquid to a treatment plant. But larger runoff events exceed sewer capacity causing the runoff-sewage mixture to overflow into our waterways. 
Wastewater Treatment Plants
Sewage collection systems deliver wastewater to a central treatment plant. The treated wastewater may be disposed of on the land or discharged into a stream, river, lake or tidal waters. Modern plants do a pretty good job of reducing organic matter (BOD-TOC) levels but require special upgrades to reduce nutrients to the point where excessive algae growth is not caused. If chlorine is used to kill the disease-causing organisms in wastewater then it can have a toxic effect upon aquatic organisms inhabiting the waters receiving the treated effluent. Many laws and programs are in place to minimize the impact of wastewater. These will be summarized in the section below headed Preventing Wastewater Impacts.
Disease & Public Health
Bacteria, viruses and other disease-causing (pathogenic) organisms can enter suburban-urban waters with stormwater runoff, through sewerline releases, septic systems, and other sources. In a 2007 report, the USEPA estimated that 45% of our streams and rivers were impaired by pathogens and sewage discharges along with 32% of our bays and estuaries. A 2017 update of the USEPA report noted that 23% of streams and rivers exhibited pathogen levels exceeding public health protection criteria. A 2004 USEPA report listed the following diseases caused by common pathogenic bacteria present in sewage: gastroenteritisis, salmonellosis, typhoid fever, cholera, shigellosis, and yersinosis. Others include the diseases caused by cryptospoidium and giardia. Symptoms of these diseases include vomiting, diarrhea, dehydration, and nausea.
Stormwater
The pathogens Cryptosporidium parvum and Giardia lambia are among those present in stormwater runoff from suburban-urban lands. One study noted that fecal coliform bacteria were present at significantly higher densities in suburban-urban waters compared to those of rural areas. The levels of these pathogens frequently exceed public health protection criteria during and immediately after runoff periods. The pathogens present in stormwater runoff come from dogs, cats, raccoons, rats, beaver, gulls, geese, pigeons and even insects. However, the wash-off of dog waste from lawns and other surfaces is thought to be a major source.
Sewerlines
In 2000, the U.S. Environmental Protection Agency estimated that a trillion gallons of untreated sewage enters our waters annually largely from sewerlines. The toilet, bath, kitchen and laundry wastewater from all homes and businesses is carried to a treatment system via pipes known as sewerlines. Leakage from these pipes can result in contamination of ground and surface waters with the disease-causing organisms present in the wastewater. The illustration below shows the sewerline system serving many U.S. homes and businesses.  USEPA estimates that here are at least 23,000 – 75,000 sewage releases from sewerlines each year. One of the more common points of release are the pipes (called laterals) that carry sewage from a home or business to a sewerline. Laterals can account for half of the total length of pipes in most sewage collection systems. Laterals are also present where sewage is treated with a septic system. One study noted that leakage of sewage from the sewer pipes into storm drain systems could be a significant source of pathogens entering suburban-urban waters. Laterals carry wastewater to both septic systems and sewerlines.
AQUATIC RESOURCE PROTECTION METHODS
This section will provide a brief history of aquatic resource protection, the measures used to minimize each of the impacts described above, how the measures are applied to individual sites, and inspection-enforcement mechanisms.
A Brief History
Measures to reduce the impact of development upon aquatic resources began appearing in the mid 1960s. At first the measures were limited to construction phase erosion and sediment controls. In the 1970s laws were enacted to reduce the physical disturbance of wetlands and waterways with bulldozers and other earth-moving equipment. It was also in the 1970s that ponds to control post-construction stormwater runoff came into use. At first the ponds were intended to control downstream flooding. Later, pond designs included provisions to reduce channel erosion. In the 1980s and 90s other Best Management Practices (BMPs) were introduced to trap stormwater pollutants. In the 1990s and early 2000s groundwater recharge BMPs came into use. Around this same time aquatic resource buffers became a common requirement and some States-localities adopted forest conservation laws. Since 2010 an increasing number of States have been requiring the use of highly-effective runoff control measures along with other new aquatic resource protection methods. These new approaches are known as Low-Impact Development, Environmental Site Design, Better Site Design, etc.
Erosion & Sediment Control
Today, most localities require a developer to submit an erosion and sediment control plan prior to clearing a site. The plan usually calls for clearing first a swath along the downslope edge of a site. Within the swath silt fence (pictured below), ponds and other sediment trapping measures are installed along with ditches (swales) or berms needed to intercept uphill runoff then direct it to the trapping measures. All exposed soils within this perimeter swath are then covered with straw mulch and seeded with grass as shown below the silt fence photo. 

 Once the perimeter is stabilized then the developer can clear uphill areas of the site. Bulldozers and other heavy equipment cut and fill sloping sites to create the relatively flat areas needed to begin building roads, houses and other structures. When this point is reached the site is said to be at Rough Grade. Many localities will require stabilization of all areas of exposed soil once rough grade is reached. Road and parking lot beds are stabilized with four inches of stone. All other areas are stabilized with enough straw mulch that underlying soil cannot be seen. Areas that will remain idle for some time are stabilized with mulch and grass. Of the two approaches, erosion control through stabilization measures is far more effective compared to perimeter sediment trapping measures. Silt fence and ponds trap maybe 5% to 50% of the eroded soil. The rest flows offsite into a nearby waterway. A cover of straw thick enough to obscure underlying soil from view reduces erosion by 90% and runoff volume by 40%. A dense cover of grass slashes erosion by 99% and runoff volume by 90%. Erosion control is the only measure that can keep the most polluting soil particles – clay – from flowing into nearby waterways. For every dollar spent on erosion control we tax-payers save at least $100 in damages avoided. So, whenever you see exposed soil on a construction site you can assume a nearby waterway will be polluted come the next major storm.
Stormwater Management
Following is a description of the Best Management Practices (BMPs) used from the late 1960s on to manage stormwater runoff from new development. This description will make more sense if we first describe Design Storms and Hydrologic Soil Groups.
Design Storms
The earliest ponds were designed to control severe flooding by managing a storm recurring an average of once every 100 years. After development the volume of runoff might double or quadruple. The pond was sized to store the difference in runoff before and after development.  The opening on the vertical spillway pipe (riser) was sized to release the stored runoff at the same rate that occurred prior to development. The ten-year storm was added to minimize the impact of lesser flood events. Next, ponds were designed to manage the two-year storm, which was thought to be key to minimizing channel erosion. Today, many states require management of the one-year storm for channel protection. Additionally, many states require passing the monthly storm through water quality BMPs designed to trap pollutants. The monthly storm produces about an inch of runoff from impervious surfaces. In many parts of the nation, a BMP designed for an inch of runoff will treat 90% of all runoff. Some states require infiltrating a lesser amount of runoff to maintain groundwater recharge at predevelopment rates.
Hydrologic Soil Groups
Soils are assigned to one of four Hydrologic Soil Groups (HSG) based on permeability and the amount of runoff generated. Soils assigned to HSG “A” tend to be sandy and produce the least runoff. “D” soils tend to be clayey or have a shallow depth to bedrock or the water table and produce the greatest runoff. Infiltration, Sand Filters and Bioretention BMPs work best on “A” and “B” soils along with some “C” soils. But these BMPs can be used on even “D” soils but an underdrain is needed, which negates groundwater recharge and probably some pollutant removal. The USDA Natural Resources Conservation Service has a great website for determining the Hydrologic Soil Groups for any site: Web Soil Survey. There’s a wealth of other information available at Web Soil Survey.
Dry Ponds
In the early days, Dry Ponds were the most common measure. These ponds were designed to store excess runoff from the 100-year storm then release it gradually after a major storm passed. As the name implies, Dry Ponds had a large opening at the bottom of the spillway which allowed it to drain completely once runoff subsided. Since there was no place to store pollutants these facilities provided zero water quality protection, no groundwater recharge and probably made stream channel erosion worse. 
Extended Detention (ED) Ponds
These ponds detained stormwater for a longer period of time. This was achieved with a Dewatering Device (see below) created by extending a perforated pipe from the bottom of the pond spillway riser. The pipe was wrapped in black filter cloth and covered with stone. With this design it would take 12- to 48-hours for the pond to drain completely. Initially ED ponds drained completely which meant very little pollution was retained and no recharge was provided. Later, ED ponds were designed to have a permanent pool of water which enhanced pollutant retention. Since the bottom of these ponds quickly sealed little recharge was provided. Both the ED Dry and Wet Ponds tended to make thermal impacts worse. ED ponds likely resolved channel erosion concerns. 
Wet Pond
These ponds store a much larger volume of runoff permanently. They are more effective than ED ponds in trapping pollutants, yet they do not provide recharge, can cause thermal impacts and may prevent channel erosion. 
Impervious Area Disconnects
Some States give credit for discharging runoff from small impervious surfaces onto grass or other vegetated areas. For this approach to work runoff must flow from the impervious surface and onto the vegetation in a shallow sheet. During most storm events all the runoff will soak into the soil. However, a large portion of the pollutants may be retained at the soil surface. During larger storm events these pollutants may be resuspended and carried into nearby waters. Another problem is that these disconnects only work as long as sheet flow is maintained. Over time twigs, leaves and other objects tend to accumulate and cause sheet flow to form into channels. Very little of the pollutants entrained in channel flow will be captured. Most will travel to the nearest waterway. In summary, disconnects are one of the less reliable practices. 
Level Spreaders & Buffers
As the name implies, this measure is intended to convert channel flow into sheet flow by directing runoff over a broad, level surface. The runoff is then discharged as sheet flow into a grass or wooded buffer. As with disconnects, debris tends to accumulate on the top of the level spreader creating channel flow, which negates water quality benefits. While buffers may be effective in removing pollutants from cropland and pasture runoff, then do not work well on development sites. But buffers do provide substantial benefits in terms of preserving aquatic habitat and providing the shade needed to moderate water temperature. 
Grass Channel
With regard to stormwater management, there are three grass channel types: grass ditches, grass swales. and Dry or Bio Swales. A grass ditch can be found along many rural roads particularly in older housing projects. They tend to be V-shaped and grass covered. As with Disconnects, the small quantity of pollutants captured by ditches accumulates at the soil surface and is washed downstream during larger storm events. A grass swale has much much wider and flatter bottom, which increases infiltration and pollutant capture but still suffers from the resuspension problem. Dry and Bio Swales (pictured below) are created by excavating a long trench, filling it with a sand-organic matter mix and then the surface is planted in grass. Because of the highly-permeable sand, pollutants are carried far enough down in the soil column that they cannot be resuspended. This type of channel is highly-effective in pollutant removal and groundwater recharge. 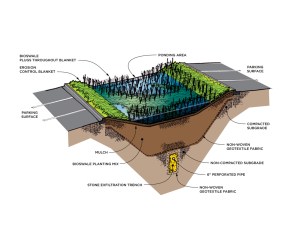
Infiltration Basins & Trenches
Both of these BMPs are restricted to permeable soils where runoff can be infiltrated. The Basin resembles a dry pond except the first spillway opening is set a foot or two above the flat Basin floor. The one- to two-foot ponding area created this way holds the first inch of runoff long enough for it to percolate down through the permeable soil on the floor. Spillway openings are designed to release runoff from the 2- to 100-year storm at predevelopment rates.  An Infiltration Trench is a rectangular pit filled with stone. Runoff is stored in the air spaces (interstices) between the stones until it can soak into adjacent and underlying soils.
  Both infiltration measures achieve very high pollutant removal, excellent groundwater recharge, can reduce channel erosion and resolve the thermal impact of heated runoff. Because of the large area draining to each they are more prone to failure then other BMP types. The larger the drainage area, the more likely soil will be exposed and eroded sediment will enter the BMP causing failure. The Trench is very hard to restore once it fails.
Green Roof
In recent years the Green Roof has become increasingly popular. A green roof is created by placing two- to eight-inches of soil on a roof then planting it with grass or other vegetation. A collection system underlies the soil to capture rainfall which has percolated through the soil. A Green Roof provides moderate pollutant removal, no groundwater recharge and minimal channel erosion protection. However, this practice can substantially lower heating and cooling cost for the underlying building. This benefit can pay for the added cost of a Green Roof after the passage of several years. 
Sand Filter
The Sand Filter was the first to appear on development sites. The filter consists of 18 inches of sand placed upon a bed of gravel. A system of perforated pipes is laid within the gravel in the event the soil beneath the gravel clogged. The pipes would then carry runoff to a storm drain inlet or some other point where it could safely discharge. Sand Filters provide a moderate degree of pollutant removal, good recharge, resolve thermal impacts and reduced the volume of flows involved in channel erosion. 
Bioretention Type Filters
The first bioretention BMPs were developed in the 1990s. They have since evolved into several variations – Micro-Bioretention, Dry Swales, Bio Swales, Landscape Infiltration, and others. Bioretention BMPs do best on more permeable soils. But when fitted with under drains they can be used anywhere that the water table rises no closer than two feet from the BMP bottom. As illustrated below, a typical facility begins as an excavation four- to six-feet deep. A perforated pipe under drain is placed in a bed of gravel on the bottom. Three- or four-feet of a sand-organic matter mix is placed above the gravel. The surface may either have a layer of two- or three-inches of hardwood mulch or be grass. The surface is depressed six- to twelve-inches so the facility can treat the first inch of runoff from the impervious surfaces draining to it. Runoff above this amount will usually exit via a pipe or concrete outlet.  Like infiltration measures, Bioretention BMPs achieve a very high level of pollutant removal, cause no thermal impact and provide excellent recharge. A number of States now design Bioretention BMPs to manage the runoff from a one-year storm which should resolve channel erosion impacts. Because of a much smaller drainage area (0.5 acres or less) Bioretention BMPs are less likely to fail. If they do fail then it will most likely be due to sediment clogging the surface which makes restoration far easier than with an Infiltration Trench.
Forebays, Sediment Chambers & Diaphragms
All three of these measures are used to trap sediment before it can reach the main portion of a BMP. BMPs usually fail because of excess sediment entry. Forebays resemble a small pond and usually receive runoff before it enters the main pond.  A sediment chamber is usually created by placing a stone, wood or concrete check dam across the upper half of a BMP. Runoff initially enters this upper half where sediment is deposited.
  A diaphragm consists of a one-foot wide by one-foot deep stone trench around the edge of Bioretention type BMPs. Runoff initially flows into the gravel where sediment is trapped. The cleaner runoff then overflows into the BMP.
Stormwater Hotspots
A number of States have identified a set of land uses which tend to produce runoff with unusually high concentrations of pollutants that can contaminate groundwater. These land uses usually involve refueling or vehicle repair and other servicing. Frequently the use of infiltration measures to treat hotspot runoff will be prohibited where a high groundwater contamination potential exists such as karst (limestone) areas, well-head protection areas, or where shallow aquifers in very sandy soil are used as public water supplies.
Highly Effective BMPs
The graph below compares pollutant removal of the various BMP categories presented above. The two pollutants compared are nitrogen and phosphorus. With the exception of road salt and a few others highly mobile in soils, nitrogen or phosphorus removal rates are much the same as for most other stormwater pollutants.  The following table compares the benefits of stormwater BMPs.
  Practices that achieve a high degree of groundwater recharge, pollutant removal and channel erosion prevention are termed highly-effective. From the table above, these practices include: Dry & Bio Swales, Bioretention and Infiltration. If all impervious surfaces of a proposed development project will drain to these highly-effective BMPs then nearby aquatic resources should not suffer due to stormwater pollution, loss of groundwater recharge or accelerated channel erosion.
Forest, Steep Slopes & Buffers
Preserving a wooded buffer along wetlands and waterways is essential to maintaining healthy aquatic ecosystems. Equally important is maintaining 45% or more of a watershed in forest. In most parts of the nation proposed development projects are required to maintain a minimum undisturbed buffer of native vegetation between the limits of disturbance and a wetland, waterway, lake or tidal creek. A number of localities also require the retention of large trees along with setting aside a certain percentage of a site for existing forest or reforestation. Also, preservation of steep slopes in not uncommon. Usually this involves slopes of 25% or greater. Such a slopes rises or falls 25 feet for every 100 feet of horizontal distance. The restriction may be limited to just steep slopes located on soils rated highly-erodible. Both of these characteristics can be determined from the Web Soil Survey.
Sediment & Stormwater Plans & Permitting
Most states have adopted manuals providing a great deal of detail regarding how and where these practices are to be applied. In other states, projects disturbing one acre or more must conform the USEPA requirements, Those wishing to develop must submit a plan showing how:
- erosion and sediment will be controlled during the construction phase, along with limits of disturbance to preserve aquatic resource buffers and existing forest; and
- stormwater runoff will be managed and that specific aquatic resource protection criteria have been met, such as pollution reduction, groundwater recharge, channel erosion prevention and minimization of downstream flooding.
If both plans conform to the State manual and local requirements then the developer must sign an agreement requiring that all plan provision will be met. The stormwater provisions then become binding on all future property owners. Something like a grading permit is then issued. Ideally a representative of the inspection-enforcement agency would meet onsite just prior to the start of site clearance to review the plans to ensure the developer and contractor understand each provision. The inspector would then return periodically to verify that BMPs are properly installed and maintained. If an inspector finds a deficiency, like the overflowing silt fence below, then the developer is notified and given a fixed period to correct the problem. If the inspector finds that the corrections have not be made then a stop-work order can be issued and or a fine imposed. Stop-work orders are most effective when they halt all activity on a site (grading, plumbing, electrical, construction, etc.). Fines only work if they are far in excess of the cost of installing or maintaining a measure.  Once site development is completed the inspector would verify that all erosion and sediment control BMPs have been removed, all disturbed soils are stabilized and all stormwater BMPs were properly installed. Another inspection of stormwater BMPs would occur a year after development completion, then perhaps every one- to three-years thereafter.
Drinking Water Protection
About 15% of our homes are served by individual wells while most are on public water supply systems. Of the public systems, 43% obtain water from community wells and the rest pump from reservoirs, rivers, lakes and other surface sources. Growth can affect both the quantity and quality of either ground or surface waters. Through the decline in recharge caused by impervious surfaces, groundwater levels can decline along with inflow to surface waters. A number of water supply sources have been contaminated by pollutants either carried into the soil then ground water or washed by stormwater into surface waters. An equally alarming impact can result from allowing growth to exceed the level that can be safely accommodated by available water supplies. This issue is later under Preventing Water Withdraw Impacts.
Community Water Systems
Public (community) water systems serving a year-round population are required to provide their customers with a Consumer Confidence Report detailing the results of water quality measurements contrasted with USEPA standards. If your home is one of the 85% connected to a community water supply system then you should receive an annual water quality report. If you don’t recall receiving a report then it may be available online via the USEPA Consumer Confidence Reports webpage. If the report is not linked, the webpage provides the contact information needed to request one from your supplier. Should a report show that any contaminants exceeded state or USEPA drinking water standards then the cause must be corrected before more homes or businesses are connected to the system.
Private Wells
Unlike community water supplies, wells serving a individual home are not routinely tested for quality. Usually well tests are conducted when a property is sold. Many local health authorities will test a well upon by request by the owner. Otherwise you can hire a commercial firm to test your well water. Data on regional well water quality may be available from the U.S. Geological Survey or state environmental agencies. The preceding provides a starting point for ensuring the adequacy of your water supply. It is vital that you ask hard questions should you suspect that reports and test results do not accurately reflect water quality. To see examples of these hard questions watch the PBS film Poisoned Water.
Preventing Water Withdraw Impacts
How can one ensure water use does not cause undue harm to other users or the environment? Use of water generally follows two broad doctrines in the United States. In western states the Prior Appropriation doctrine generally says that the first person to make use of a water resource has the right to continue that use. Others can make use of whatever is left over. In the east, the Riparian Rights Doctrine allows property owners to make reasonable use of the water on or adjoining their property provided the use does not adversely affect other uses and the environment. Of course there’s much more to both doctrines. The Prior Appropriation Doctrine is being hotly disputed in light of the California drought. For larger groundwater withdrawals, many states require a pump test to see how much the proposed use will draw down the underground reservoir surface. If the proposed rate causes a significant drop in water levels at nearby wells or off the project site, then the withdrawal rate must be reduced.  A water balance analysis will frequently be required for both ground and surface water withdrawals. Some States require that a proposed groundwater use be limited to the amount of recharge occurring on the site less the amount needed to preserve other uses. In Maryland, recharge averages 900 gallons per acre per day then half this amount during a drought. About 100 gallons per acre is set aside for aquatic resource protection. So a proposed use on a one-acre site could withdraw 800 gallons per day under normal conditions but only half this amount come a drought. For streams and rivers several methods are in use to determine how much water is needed to safeguard aquatic organisms. The simplest is known as the Tennant Method, which calls for maintaining summer flows at 40% of the mean annual stream flow. At 40% good conditions are maintained. At 30% and 10% conditions are Fair and Poor, respectively. For example, in Maryland stream flow averages about one cubic foot per second per square mile of watershed area. So if a stream drains one square mile then summertime withdrawals should not cause flow volume to drop below 0.40 cubic feet per second if Good conditions are to be maintained. While all waters should be maintained in Good condition, its easiest to make a case for this flow when waters support a highly-regarded, important resource like gamefish, threatened-endangered species or the flow is needed to protect downstream water users. At least one study has found that the Tennant Method yields minimum flows close to that predicted using more sophisticated methods, like the Instream Flow Incremental Methodology developed by the U.S. Fish & Wildlife Service. With regard to the impact of a proposed major groundwater withdrawal, you should insist that a thorough hydrogeologic study be prepared including the results of aquifers pump tests done on site along with observation wells located off-site. Unfortunately you’ll need the assistance of a hydrogeology expert to interpret the report. There are a number of these professionals in the CEDS network. This study is even more important if your area has a history of well failures and the need for replacement wells. Some of the agencies which may have this data include your:
- local or state health department;
- state water resources agency;
- state geological survey; or
- the U.S. Geological Survey.
Your state water resources agency as well as your state or U.S. geological survey may have the stream flow data needed to determine if a new use will lower summer stream flow to less than 40% of the annual average. Procedures for calculating average annual flow have been prepared by Oregon State University.
Preventing Wastewater Impacts
The prevention of wastewater impacts will be addressed under three headings: septic systems, wastewater collection systems and wastewater treatment facilities.
Preventing Septic System Impacts
The septic tank was invented in 1860. Today they are part of a category of wastewater treatment facilities known as Onsite Sewage Disposal systems (OSDs). Approximately 25% – 30% of all USA homes are served by OSDs and are mostly located in rural areas. The system consists of a tank where solids settle from suspension. Tank effluent then flows to the drainfield where it is released into the soil via a series of trenches or pits. The removal of pollutants and disease-causing organisms is far from 100%. And if the solids are not periodically removed from the tank the system can fail completely and result in sewage coming to the ground surface. OSD owner education is crucial to keeping these systems working.  A number of researchers have found a general relationship between septic system density and water quality. The USEPA defines an area as having a high density when there are 40 or more OSDs per square mile (or one system per 16 acres). In the post-WWII development boom many septic systems were built on lots as small as a ¼ acre. A large percentage of these systems failed and the homes are now connected to a wastewater collection system. Today, many states limit OSDs to lots one-acre or larger. OSDs are limited to soils that pass a percolation (perc) test to prove that infiltration rates are acceptable. There should be enough suitable soils to allow for the construction of an initial drainfield and at least two replacement fields. Very clayey soils and those where the water table or bedrock is close to the surface are usually unacceptable. OSDs should not be located upslope of a well. Usually minimum setbacks are required from property lines, steep slopes, waterways, wetlands, water bodies, and some stormwater BMPs. General information about site suitability for OSDs can be found on the USDA Web Soil Survey site. CEDS does a detailed comparison between these setbacks and local requirements whenever reviewing site plans for projects served by OSDs. We urge you to do the same.
Preventing Wastewater Collection Impacts
Many miles of pipes collect wastewater from each home, school or other building in the nation then carry it to a plant where the sewage is treated. The system is divided into separate sewers which only carry wastewater and combined sewers that also receive runoff from streets and other surfaces. The USEPA estimates that annually there are 40,000 releases totaling 10 billion gallons of wastewater from separate collection systems. And releases are even more frequent from combined systems.  The most common cause of separate sewerline overflows is a blockage of the pipe. Even worse than sewage spilling into a nearby waterway are those occasions when the blockage causes sewage to backup into a home. About a fourth of all sewage releases are due to ground or surface water getting into separate sewers through: cracks in the pipe, manholes in low-lying areas or storm drains illegally connected to the sewer. Power outages and other mechanical failures at sewage pumping stations account for another 11% of the 40,000 annual separate sewer spills.
  If a proposed development project will connect to a sewerline then contact your local public works department or sewer authority to find out whether the system has sufficient capacity to accommodate the increased flows. Most states have adopted tables showing the amount of wastewater generated by different land uses. For example, Connecticut officials assume 0.057 gallons per day per square foot of a proposed shopping center. So a 160,000 square foot center would generate 9,120 gallons of wastewater per day. If you know how many gallons of capacity remain in a sewer you can use these tables to determine if a development project will exceed the remaining capacity. If a project will discharge to a pumping station with a history of frequent spills then its reasonable to insist the cause be corrected before the project is allowed to release additional sewage to the station.
Preventing Wastewater Treatment Plant Impacts
There are thousands of wastewater treatment plants in the nation. A great introduction to these facilities is provided in the USEPA Primer for Municipal Wastewater Treatment Systems. They are designed to eliminate a portion of the pollutants contained in wastewater. In the case of disease-causing organisms the removal rate can be very near 100% through the use of chlorine, ultra-violet light or other disinfectants. Many of these plants are owned and operated by local or state agencies. Each plants holds a National Pollution Discharge Elimination System (NPDES) permit. The permit contains limits on the types and amounts of pollutants that can be released from the plant. These limits may be based on national guidelines or the result of a Total Maximum Daily Load (TMDL) evaluation of water quality violations in the receiving waters.  The treated effluent may be disposed of through application to the land or discharged into a waterway or water body. Most states have received authority to administer their own NPDES program. These states reviews, issues and enforces each permit. Each permittee is required to submit regular Discharge Monitoring Reports (DMR). The DMRs contain the results of tests conducted at various points within the plant, beginning with where wastewater first enters then ending where the treated effluent is discharged. In addition to this self-reporting, the delegated states will send out inspectors to collect their own samples and to do a visual evaluation of plant condition. Unfortunately, many states simply lack enough inspectors to visit plants regularly. Some States set a policy that plants discharging one million gallons a day or more get inspected at least once a year. Others plants may be inspected only once every three to five years. This is wholly inadequate and results in pollution violations that drag on for weeks, months or even a year or more. If you are concerned about a proposed development project that will connect to a sewerline then determine how well the treatment plant complies with their NPDES permit. To do this visit USEPAs Environmental Compliance History Online (ECHO) website. After you figure out how to navigate around, you’ll find a wealth of information about the treatment plant. If the plant has been flagged for significant violations then it would be reasonable to call for limiting new development and additional wastewater until the violations have been corrected.
EVALUATING AQUATIC RESOURCE PROTECTION
Following is general guidance for assessing how well a project has been planned with regard to aquatic resource protection. Usually an assessment can be made from a site plan which may also be called a development plan. Special Exception, Conditional Use or Concept plans usually lack the detail needed to make an assessment, but are better than nothing. To obtain project plans contact your local planning and zoning office or the developer directly. Ask if you can get either a paper copy of the plans or an electronic version. We find a pdf of plans easiest to work with plus they can be emailed. Following is a checklist for evaluating aquatic resource protection.
- Will all impervious surfaces drain to BMPs rated High for recharge, pollutant removal and channel erosion prevention?
- Are buffers shown along all wetlands, streams and other aquatic resources on or adjacent to the site?
- Will forest conservation requirements be met onsite?
- Are steep slopes protected from disturbance?
- If the project will rely upon groundwater then does your area have a history of well failure? If yes then you should insist upon a hydrogeologic study before the project is approved.
- If the project will use an unusually large amount of ground and surface water then a water balance should be conducted to verify summer stream flows will not be reduced to 40% or less of average daily flow.
- If Onsite Sewage Disposal systems are proposed then do site conditions fully meet all applicable criteria?
- If project wastewater will be discharged to a sewerline then does the:
- sewerline have a history of no overflows;
- sewerline have adequate capacity;
- wastewater treatment plant free of significant violations; and
- plant have adequate capacity to handle the increased flow?
WATER QUALITY MONITORING
Sampling aquatic resources for bacteria, dissolved oxygen and other physical, chemical or biological parameters is important. However, monitoring alone is not the shortest route to clean water. At most, monitoring reveals existing and past impacts. It does not prevent future impacts as do Watershed Audits. Also, most monitoring is done on nice, sunny days whereas water quality tends to be poorest when rainfall has washed pollutants into a waterway. Nevertheless, monitoring is an important element in a comprehensive program to preserve and enhance aquatic resource health. Following are links to water quality monitoring guidance documents:
- Volunteer Lake Monitoring: A Methods Manual
- Citizen lake Monitoring Program Instruction Manual
- A Citizens’ Guide to Understanding and Monitoring Lakes and Streams
- Volunteer Stream Monitoring: A Methods Manual
- Volunteer Estuary Monitoring: A Methods Manual
Again, water quality monitoring is most effective when paired with a Watershed Audit.
WINNING BETTER AQUATIC RESOURCE PROTECTION
If a plan meets the four evaluation criteria listed above then there is an excellent chance the project can be built with very little, if any, negative impact to aquatic resources. Of course there are two caveats. First, the agencies overseeing plan implementation must have a record of achieving a high degree of compliance. This issue is addressed in detail below in Inspection, Maintenance & Enforcement. Second, the project does not impact uniquely important or highly-sensitive aquatic communities. The new approach is experimental and only time will tell how well it will work. In the interim its best to keep impervious area threshold below the levels given in the table above: Impervious Area & Aquatic Resource Damage in uniquely important, highly-regarded watersheds. So what if the plan fails to meet the four criteria? Well, the next question is: Does current law and policy require that all four criteria be met? If yes, then refer to the following chapters in our free 300-page book How To Win Land Development Issues to learn how you can work with staff and their superiors to win greater compliance:
- Chapter 38: Working with Regulatory Staff;
- Chapter 39: Lobbying Final Decision-Makers; then
- Chapter 37: Negotiate with the Applicant.
If no, current law and policy does NOT require compliance with all four criteria then consider changing the law. Strategies for achieving this goal are also described in How To Win Land Development Issues chapters:
- Chapter 41: Changing the Law;
- Chapter 36: Mobilizing Support For Your Strategy;
- Chapter 38: Working with Regulatory Staff;
- Chapter 39: Lobbying Final Decision-Makers; then
- Chapter 42: Electing & Retaining Decision-Makers Committed To Responsible Growth Management.
Please feel free to contact us if you have any questions about how to win better aquatic resource protection: 410-654-3021 or Help@ceds.org.
CEDS REVIEW OF PROJECT PLANS
If you wish CEDS can review plans for a project of concern to you. Usually we can do a no-cost quick review for the four issues given above. We can then share our findings along with strategy recommendations via a conference call with you and your allies. To get your project on our brief waiting list contact us at Help@ceds.org or 410-654-3021.
INSPECTION, MAINTENANCE & ENFORCEMENT
The Achilles Heel of aquatic resource protection is the oversight provided by local and state agencies to ensure only good plans are approved, BMPs are installed properly then maintained as long as necessary. In some localities only 12% of construction sites fully comply with erosion control laws. In others up to half of stormwater BMPs are failing due to a lack of inspections, then maintenance. But this problem can be turned around and it doesn’t require expensive and lengthy law suits. In fact the best strategy is to organize citizen leaders to go out for a few hours to see how well construction site pollution is being managed and to assess the condition of stormwater BMPs. This approach costs almost nothing and has produced up to a 61% improvement in compliance in as little as a few months. CEDS has created several models for how you can ensure effective enforcement in your area:
- Greater Baltimore Survey: 2015 Survey Shows Construction Site Erosion Control Improves 61% Compared to 2014;
- Stormwater Best Management Practices Greater Baltimore Survey 2016; and
- Montgomery County MD Environmental Site Design Audit.
For reasons that are unclear, few watershed organizations have assessed the compliance levels in their area with regard to construction site mud pollution and stormwater BMP maintenance. While these groups are engaged in very worthwhile education and restoration projects, the benefits of their efforts seldom show up in water quality data. This is frequently because excess pollution due to poor compliance masks the benefits achieved through education and restoration. It appears that part of the reason why watershed advocates tend to shy away from compliance oversight is fear of angering government officials and other funding sources. I suspect if the members of these groups were polled about activities which should be a priority, ensuring compliance with Clean Water laws would be near the top of the list. Fortunately, CEDS has developed an approach for improving compliance without making regulatory agencies look bad. And the approach imbues watershed groups with respect, not merely tolerance. Instead of blaming agency staff for poor compliance, the message is…
We know inspection-enforcement staff and our elected officials are deeply committed to minimizing pollution, but they lack the public support needed to do their job.
Supporting agencies in improving compliance is usually the quickest, least costly way of dramatically improving water quality. Additional guidance on assessing and improving compliance levels can be found at the following CEDS web pages:
- Watershed Audits;
- Exposed Soil = Pollution;
- Environmental Site Design for Clean Water Advocates; and
- Greater Baltimore Survey.
Please contact CEDS at 410-654-3021 or Help@ceds.org if you have any questions about assessing and improving compliance in your area. We can also discuss the possibility of CEDS conducting an assessment on your behalf or anonymously. Following are a couple of examples: Severn River (suburban) and Corsica River (agricultural) Watershed Audits.
WATERSHED GROWTH MANAGEMENT
Many of the more densely populated areas of the nation have adopted a plan to guide future growth. It may go by names such as master plan, growth management plan, comprehensive plan, general development plan, etc. Most of these plans will contain a chapter on natural resources which then contains a section on aquatic resource protection. Following are the key items of information missing from most plans.
- Existing impervious area for waterways third order or larger, nontidal and tidal;
- Existing impervious area for wetlands, ponds, lakes and other water bodies deemed important because they are the focus of residential communities, support threatened-endangered species, are highly regarded for recreation, serve as a water supply source, are of exceptionally high quality, or are important for other reasons;
- Existing forest cover and extent of 100-foot riparian buffer for all of the aquatic resources listed in #1 and #2, above;
- Future impervious area for all the resources listed in #1 and #2 at build-out under current zoning;
- For those aquatic resources which would exceed impervious area (IA) thresholds given above under Impervious Area & Aquatic Resource Damage, determine which are so important, so irreplaceable that exceeding the IA threshold cannot be risked. For these waters one should employ measures to keep future IA below the threshold, such as downzoning, land preservation through easements or acquisition, retrofitting existing IA with highly effective BMPs, etc.
- With regard to the uniquely important irreplaceable resources that will not meet the forest cover-buffer threshold for good to excellent conditions, use the techniques suggested in #5, above;
- Include text in the plan strongly recommending the use of the highly-effective aquatic resource protection measures described in this webpage for development in all other watersheds; and
- Require that annexation-rezoning proposals or requests to extend public water-sewer go through a detailed analysis to determine if uniquely important or irreplaceable resources will be threatened.