
- The ways in which excessive traffic can impact a neighborhood and the environment;
- How to prevent proposed development projects from causing congestion and other safety issues; and
- How your local and state government should be managing traffic on a regional scale.
Preventing Impacts Is Easy
We assume you’re visiting this webpage because you’re concerned about how a proposed development project may traffic on your neighborhood street, at your children’s school or where you work. If you are like most folks new to this form of advocacy you probably think its both difficult and expensive to prevent impacts. The good news is that its actually quite easy. And you probably don’t need a lawyer or any other professionals. The reason is that its generally easy to modify most development proposals to utilize the highly-effective traffic management measures that have come into use over the past decade. And these measures can actually save the developer money. With your support the developer can probably gain approval from permitting agencies to use these measures. We’ve found most development companies are anxious to work with citizens who have realistic solutions to potential impacts. We call this approach Equitable Solutions. We have a webpage devoted to the approach where you’ll find detailed advice on how to make it work for you: Equitable Solutions webpage.Traffic Impacts
This section provides a description of the impacts commonly resulting from poorly managed growth. Options for preventing proposed development from causing these impacts is described in the next section: Preventing Traffic Impacts Caused By Proposed Development.Accidents
According to the Centers for Disease Control & Prevention, nationwide motor vehicles accidents are:- A leading cause of death; and
- Productivity losses and medical care costs due to traffic accidents total $430 billion annually.
Air Quality & Health
A typical U.S. car emits enough pollution to create five tons of carbon dioxide a year. Cars and trucks produce half of all toxic air pollution emitted in the U.S. Estimates indicate that air pollution from cars results in 120,000 premature deaths each year in the U.S. Traffic generated air pollution also accounts for $40-$50 billion in health care costs each year in this country. In addition to these regional issues, some proposed development projects can create localized air quality problems. Locating a truck stop next to homes could create a health issue if diesel engines are idling for long periods. And whenever there is a large increase in truck traffic on a road lined with homes there will likely be an increase in the concentration of the particles emitted from diesel engines that account for most of the respiratory impact. There is some evidence indicating that those living within 600 feet of a major highway may be particularly at risk due air pollution. Large gas stations are another source but are addressed on the CEDS Convenience Stores & Gas Stations webpage.Aquatic Resource Impacts
A new road can destroy aquatic resources when built upon a wetland, stream or other aquatic resource. One would think that this is no longer permitted, but that’s sadly not the case. Nationwide thousands of permits are issued annually allowing new development – particularly roads – to be built within waterways. But the greatest impact is the tremendous quantity of pollution washed from road surfaces with each storm. These pollutants include nutrients, sediment, and road salt along with a long list of toxic and even carcinogenic contaminants. A large portion of the pollution comes from vehicle exhaust as well as engine-body wear. Generally, as traffic volume increases the quantity of these pollutants increases as well. While these impacts can be greatly reduced they cannot be eliminated. This is why its vital that new roads be restricted where they may impact high-quality waters or highly-sensitive aquatic resources.Noise, Health & Property Value
Traffic noise can interfere with sleep, conversation, and other neighborhood pursuits. About 9.5% of us are exposed to traffic noise at a level which affects health. Sound becomes noise when it interferes with our quality of life. Sound is measured in units known as decibels (dB) and highway noise is measured on an “A-weighted decibel” (dBA) scale. 70 dBA is eight times as loud as 60 dBA. The noise level in a library might be 30 dBA while an air conditioner would emit 60 dBA. Traffic volume, speed, and vehicle type all affect noise levels. At 2,000 vehicles per hour (vph) traffic noise will sound twice as loud as at 200 vph. Traffic moving at 65 mph will sound twice as loud as at 30 mph. And one truck traveling at 55 mph will sound as loud as 28 cars moving at the same speed. Traffic noise can have a significant effect on property value. A home located adjacent to a major highway may sell for 8% to 10% less when compared to one located along a quiet neighborhood street. Heavy truck traffic lowers property value at a rate 150 times greater than cars. This is because at 50 feet heavy trucks emit noise at 90 dBA while a car traffic produces noise at a level of 50 dBA.5 An increase in heavy truck traffic may also cause damage to nearby homes through vibrations transmitted through the earth. While some truck traffic is essential on neighborhood streets (e.g. refuse collection, delivery trucks, and fire engines) an increase in trucks passing through a neighborhood could lower property value and overall quality of life. Land uses that generate large amounts of truck traffic, such as mining, landfills or power plants, should be sited where there’s direct access to major highways; not residential streets.Pedestrian Safety
In 2013, 4,735 pedestrians were killed in the U.S. by automobiles and 55% of these fatalities occurred on neighborhood streets. For every pedestrian killed by a car, another 15 were injured. Speed is a major factor determining whether a pedestrian will be killed or injured by an automobile. A pedestrian is nine times more likely to die if struck by a car traveling at 30 mph compared to 20 mph. Other factors contributing to the high pedestrian accident rate on neighborhood streets include lack of adequate sidewalks, bike lanes, and crossings.Truck Traffic & Cyclist Safety
There’s a large and growing body of scientific research showing that trucks, especially large one like those with three axles or more, pose a unusually high threat to cyclist safety. CEDS compiled some of these studies into Cyclist Safety & Truck Traffic: A Summary of Some Relevant Research. The studies summarized in this publication show that of all the traffic sharing roads with cyclists, trucks in general and large commercial trucks in particular (aka, tractor-trailers, semis, 18-wheeler, etc.) pose the greatest threat to cyclist safety. Consider the following from the 2024 article How can cities increase the safety of large vehicles in urban areas? posted on the Vision Zero Network website: “Large vehicle traffic is a common sight on U.S. city streets. From waste disposal and utility trucks, to delivery vans and buses, these large vehicles make up a small fraction of vehicles on urban streets, but they are disproportionately involved in fatal crashes, particularly involving people walking and riding bicycles (p. 1). Although large trucks comprise only 3.6% of vehicles in New York City, they are responsible for 32% of bicyclist fatalities and 12% of pedestrian fatalities. During a recent 5- year period, 1,746 pedestrians and bicyclists in the U.S. were killed from impacts with large trucks, according to the National Transportation Safety Board (p. 2).” In the 2023 report A National Investigation on the Impacts of Lane Width on Traffic Safety, researchers noted that the narrower road lanes are, the safer they are for pedestrians, cyclists, and vehicle occupants. However, narrower lanes become less desirable to traffic officials when truck traffic volume is relatively high (greater than 10% of total traffic volume). If this generalization holds true for roads affected by a proposal that could increase truck traffic then:- If the affected road supports significant cyclist traffic or is proposed to do so in the future, and
- The road is slated to be narrowed by adding bike lanes, and
- A proposal would increase truck traffic volume on the road above 10%
Wasted Time
Traffic congestion is one of the most frustrating and costly symptoms of poorly regulated growth. Today a typical commuter spends an extra 42 hours traveling due to congestion which is up from 18 hours in 1982. Every weekday we spend 14.5 million hours stuck in congested traffic. That’s a lot of time spent unproductively. In 2014, the costs related to congestion totaled $160 billion nationally. And we wasted 3.1 billion gallons of fuel while stuck in congestion. While one often hears that new development is needed to bolster the local economy, it is rare to see the other side of the balance sheet showing for each dollar added how much is lost due to wasted time along with health impacts, reduced property value, etc. This issue is addressed in detail below under the heading Congestion & Economic Development.Wildlife
New roads can harm wildlife if wetlands or waterways are destroyed, upland forests or other habitat is bulldozed away, barriers to fish and wildlife migrations are created and due to vehicle collisions with wildlife once the road is built. Of course pollutants washed from road surfaces also harms wildlife. Traffic noise also has a significant, negative effect on birds and mammals. Nationwide one- to two-million animals are killed on our roads annually.Preventing Impacts from Proposed Development
A new housing project, office building or shopping center can increase congestion and delay, cause accident rates to increase or turn a once quiet neighborhood street into a noisy danger zone. Following is a brief description of the traffic related issues CEDS examines when reviewing a proposed development project. Through our Equitable Solutions and Smart Legal Strategy approach we resolve 90% of the issues we identify.Adequate Public Facilities
An Adequate Public Facilities law restricts development when traffic congestion would exceed a specific threshold. An APF law is also known as concurrency requirements, a subdivision staging policy, growth policy, and by other labels. To prevent excessive delay and an increase in traffic accidents the law must either:- prohibit development that would exceed the threshold, or
- require the developer to make the road improvements needed to increase traffic capacity and drop congestion below the threshold.
- Adequate Public Facilities Ordinances: An Effective Land Use Tool for Local Governments in Georgia;
- Creating Effective Land Use Regulations through Concurrency;
- Concurrency: Levels of Service for Public Access; or
- Keeping a Foot in Each Camp: Adequate Public Facilities Ordinances as Both a Concurrency Tool and Means of Generating Revenue.
Aquatic Resource Impact Minimization
Traffic related impacts to wetlands, streams, rivers, lakes and tidal waters result from building new roads within 100 feet of these aquatic resources or from the pollutants washed from road surfaces by stormwater. Groundwater is another aquatic resource which can impacted by covering the land surface with asphalt, concrete or other impervious surfaces. These impervious materials prevent precipitation from soaking into the earth and recharging groundwater systems. But traffic pollutants can also be carried into adjoining soils and cause well contamination. Road salt is probably the best example of a traffic related polluted which has caused extensive ground and surface water contamination. With the exception of road salt, stormwater filtering-infiltration systems are highly effective in removing most pollutants from road runoff and maintaining groundwater recharge. As shown in the graph above, some of the most effective systems are known as bioretention, micro-bioretention, dry swales or bio swales and other infiltration measures. An example of these highly effective systems is shown below. However, it is not uncommon for citizens to be deceived into thinking a proposed system is highly-effective when, in fact, it is not. It is vital that the system consist of the layers pictured below and that it be designed to treat the first inch of runoff from all impervious surfaces draining to it.
 Keep in mind that even these highly-effective systems are not fool-proof and they can fail quickly if not well maintained. If a development site drains to highly-sensitive waters like those supporting threatened-endangered species or a public water supply, then its best to limit the amount of impervious surfaces in the watershed to less than 5% coverage. During the road construction phase it is very important that exposed soils be quickly protected from erosive forces with straw mulch, grass seeding and other temporary stabilization measures.
Congestion
Intersections with traffic signals and road segments are rated on a scale of A to F with regard to congestion. This system is known as Level Of Service or LOS. Most roads operate at a congestion-free “A” LOS during the wee hours of the morning. But LOS is based upon conditions during the morning (7:00 – 9:00 am) and evening (4:00 – 6:00 pm) rush-hours. An LOS of “E” and “F” is generally considered unacceptable. In fact an “F” LOS is gridlock.
 Note two lanes of traffic in the photo to the left. Traffic flow in the left lane is typical of a C LOS while the right lane is operating at A or B. The above photo shows F or gridlock.
Most local and state traffic agencies will seek to prevent congestion from dropping below a “D” LOS for suburban-urban areas and “C” or better for rural roads. At an LOS of “E” you’ll spend two to four more time in congested traffic compared to a “D” level of service. In ultra urban settings traffic managers may have no choice but to allow LOS to drop to “E”. But at the high population density of these ultra-urban areas mass transportation becomes a viable a solution to preventing congestion from getting even worse. Most traffic officials and engineers rely upon the procedures set forth in the Highway Capacity Manual to assess Level Of Service. Unfortunately these procedures require a considerable amount of data and expertise to make an accurate assessment of LOS. However, some localities assume that LOS drops from “D” to “E” when any single lane has a volume greater than 1,460 vehicles per hour (vph), though the actual figure varies with design speed and other factors. Here are a couple of indicators of excessive congestion:
Note two lanes of traffic in the photo to the left. Traffic flow in the left lane is typical of a C LOS while the right lane is operating at A or B. The above photo shows F or gridlock.
Most local and state traffic agencies will seek to prevent congestion from dropping below a “D” LOS for suburban-urban areas and “C” or better for rural roads. At an LOS of “E” you’ll spend two to four more time in congested traffic compared to a “D” level of service. In ultra urban settings traffic managers may have no choice but to allow LOS to drop to “E”. But at the high population density of these ultra-urban areas mass transportation becomes a viable a solution to preventing congestion from getting even worse. Most traffic officials and engineers rely upon the procedures set forth in the Highway Capacity Manual to assess Level Of Service. Unfortunately these procedures require a considerable amount of data and expertise to make an accurate assessment of LOS. However, some localities assume that LOS drops from “D” to “E” when any single lane has a volume greater than 1,460 vehicles per hour (vph), though the actual figure varies with design speed and other factors. Here are a couple of indicators of excessive congestion:
- During rush-hour it frequently takes two or more green cycles to get through an intersection with a traffic light; or
- It takes you twice as long to get to your destination during rush-hour compared to making the same trip at, say, 10:00 am or 2:00 pm.
Congestion & Economic Development
In 2009, the Reason Foundation released a report on Gridlock and Growth. This study determined that severe congestion reduces economic health – expressed as Gross Regional Product – by 6% to 30%. Maintaining access to Central Business Districts (CBD) is particularly important. A 10% decrease in accessibility to a CBD can reduce recreational productivity by about 1%. But congestion around other common employment centers – suburbs, malls, universities and airports – can also reduces regional economic health. A University of Pennsylvania study documented that productivity growth slows when the annual hours of delay per commuter exceeds 39 hours. Another study indicated that employment growth slows due to greater difficulty in attracting works when congestion caused delay exceeds:- 28- to 32-annual hours;
- when the average delay per one-way auto commute exceeds 4.5 minutes; or
- traffic volume on freeways and other limited access, high-speed roads exceeds 11,000 vehicle per lane day.
Cyclist Safety
The State of Florida has been leading the rest of the nation in developing criteria for allowing bicyclists and motor vehicles to share the road. The safest bike lanes are separated from traffic flow by a physical barrier, like a concrete wall.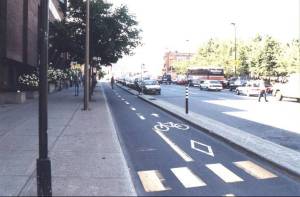 There are actually procedures for rating Bicycling Level of Service based upon motor vehicle traffic volume, speed and bike lane configuration. A number of local governments require that new development projects not cause existing bike lanes to drop below a specific LOS. If they do then the applicant would have the option of covering the costs of bike lane improvements which would resolve the LOS conflict.
Dead-End Street Length
A dead-end street is also known as a cul-de-sac or a court. Some local development regulations contain a limit on the length of a dead-end street. The limit is prompted by concerns that homes located along the cul-de-sac may be cut-off from emergency services if the road is blocked by a fallen tree, a mudslide or floodwaters. The length limit is typically in the range of 1,000- to 2,000-feet. If such a limit is imposed in your area then the developer may be forced to find a second means of access or to cut proposed cul-de-sacs back to the limit. If you’re concerned about your dead-end street being converted then see Turning Dead-End Streets Into Through-Roads below.Habitat Protection
Wetlands, streams, rivers, lakes, tidal waters and other aquatic habitats are best protected by maintaining a 100-foot buffer of native vegetation between the habitat and the limits of disturbance. To the extent possible, new roads should not pass through forest stands. Nor should they create more than a 300-foot break in migration corridors. For further detail see the FHWA Wildlife & Highways webpage.High Accident Locations
If an intersection or road ranks among the most dangerous in an area then new development should not be allowed if it that would add more cars exacerbating accident rates. A number of cities, counties and states publish list of the 10 to 20 worst roads or intersections with regard to accidents. If such a listing is not available for your area then frequently you can obtain accident (crash) data and do your own analysis. An example of a CEDS analysis of accident locations is posted at: Howard County, MD Neighborhood Streets Have Highest Accident Number. If a proposed development project will add traffic to one of the most dangerous locations in your area then it should not be approved until the cause(s) have been corrected. If correction is not practical then approval should be denied.Induced Traffic
A curious phenomenon, known as Induced Traffic, has been observed when a new road is opened in a congested area – traffic volume increases. The explanation offered is that motorists who used to stay home to avoid congestion make more trips by car once a new road relieves congestion. This is one of the many reasons why it is vitally important to carefully study every option for resolving congestion. In fact, a number of officials have concluded that its usually not possible to resolve congestion just by building new roads. This is particularly true when a new major road opens a rural area up for development.Intersection Density
As the number of intersecting driveways, streets or other access points increases so does the probability of accidents. This relationship has been confirmed through studies conducted in Delaware, Illinois, Michigan, New Jersey, Oregon, Texas, Virginia and Wisconsin. This research showed that going from 10 access points per mile to 60 would triple the accident rate. Each additional access per mile of roadway increases the accident rate by about 4%.Intersection Spacing
If a new street is proposed then it should intersect the existing road directly opposite an existing street. If this is not possible then the developer may be required to create the new intersection a minimum distance from existing intersections, such as say 300-feet. For further background see Driveway & Street Intersection Spacing.Level of Service
Intersections with traffic signals and road segments are rated on a scale of A to F with regard to congestion. This system is known as or LOS. Most roads operate at a congestion-free “A” LOS during the wee hours of the morning. But LOS is based upon conditions during the morning (7:00 – 9:00 am) and evening (4:00 – 6:00 pm) rush-hours. An LOS of “E” and “F” is generally considered unacceptable. In fact an “F” LOS is gridlock.
- During rush-hour it frequently takes two or more green cycles to get through an intersection with a traffic light; or
- It takes you twice as long to get to your destination during rush-hour compared to making the same trip at, say, 10:00 am or 2:00 pm.
Main Road Traffic & Neighborhood Streets
As congestion increases on main routes, commuters tend to use less crowded neighborhood through streets as a way around congested road segments. This action can greatly increase not only volume on the neighborhood street but average speed as well. Because of this CEDS traffic engineers will assess development proposals for the likelihood of increasing traffic on local streets even if the project access is onto a main road.Neighborhood Streets & Traffic Volume
In the portion of this webpage on Congestion, above, it was stated that unacceptable conditions may not occur until a single lane is carrying more 1,460 vehicles per hour. Unfortunately, this same standard is the only one considered for neighborhood streets in far too many localities. Instead, one should look at the volumes which trigger the need for Traffic Calming measures such as speed humps. Most traffic agencies use a threshold of 1,000- to 2,000-vehicles per day (vpd) before calming measures will be considered. This volume of traffic would be generated by 83 to 200 homes along a street. Proposed development projects should not cause traffic volume on an existing neighborhood street to exceed this volume. If it will then the developer should be required to cover the cost of installing calming measures. But even with calming measures traffic volume on a neighborhood street probably should not exceed 5,000 vpd. For further detail see: Neighborhood Streets & Cut-Through Traffic.
Noise Minimization
The best way to minimize noise on neighborhood streets is to keep traffic volume low. It is particularly important to prevent land uses that generate large volumes of truck traffic from being sited at locations where these heavy, noisy vehicles must travel neighborhood streets. Highway noise can be disturbing for those living up to a mile from a high-speed, limited access road. Noise barriers can reduce impacts for homes located within the noise shadow created by the barriers. Forest and noise fences tend not to be very effective.Parking
This issue can be quite the two-edged sword if one lives near a site proposed for an intensive use and is concerned about aquatic resource impacts. On the one-hand too little parking on the intense use site means overflow parking may exhaust all the spaces on nearby streets. But creating excess parking at the site means far more impervious surfaces and a much greater volume of stormwater pollution. Residential parking permits is one option for protecting neighborhoods but effectiveness depends upon enforcement. The table below provides examples of the formulas used to estimate parking needs. GFA in the table means Gross Floor Area and includes the surface area of all floors within a building, from basement to uppermost floor. A 2,500 square foot convenience store would require (2500 ÷ 1000 x 5.3 =) 13 parking spaces. While the standard reference is Parking Generation, many local governments have adopted their own formulas which appear in zoning, subdivision or land use regulations. And CEDS has occasionally succeeded in showing that a parking ratio is too low or high. In other words, you need not accept ratios as infallible. Megachurches and other uses will occasionally utilize off-site parking. Patrons are then bused from the off-site lot to their destination. This can be a good way to minimize parking lot size and stormwater runoff. But it may also be a way of shoehorning a use onto a site which is too small and inappropriate.
A typical space measures 9- by 18-feet or 162 square feet. But with turning lanes and other features, 290 square feet are needed to accommodate each vehicle parked in a lot. Parking spaces cost an average of $18,000 each to construct. One study indicated that it cost 67% more for spaces in an above-ground garage and 97% more for spaces created underground. Garages have a tremendous environmental benefit in generating far less stormwater pollution and requiring less habitat destruction.
GFA in the table means Gross Floor Area and includes the surface area of all floors within a building, from basement to uppermost floor. A 2,500 square foot convenience store would require (2500 ÷ 1000 x 5.3 =) 13 parking spaces. While the standard reference is Parking Generation, many local governments have adopted their own formulas which appear in zoning, subdivision or land use regulations. And CEDS has occasionally succeeded in showing that a parking ratio is too low or high. In other words, you need not accept ratios as infallible. Megachurches and other uses will occasionally utilize off-site parking. Patrons are then bused from the off-site lot to their destination. This can be a good way to minimize parking lot size and stormwater runoff. But it may also be a way of shoehorning a use onto a site which is too small and inappropriate.
A typical space measures 9- by 18-feet or 162 square feet. But with turning lanes and other features, 290 square feet are needed to accommodate each vehicle parked in a lot. Parking spaces cost an average of $18,000 each to construct. One study indicated that it cost 67% more for spaces in an above-ground garage and 97% more for spaces created underground. Garages have a tremendous environmental benefit in generating far less stormwater pollution and requiring less habitat destruction.
Pedestrian Safety
Until recently our obsession with cars has resulted in vast areas where one literally risks their life trying to walk from one suburban location to another. Particularly disturbing is the absence of sidewalks for children to use in getting from their homes to school. Fortunately many local governments now require developers to include sidewalks and walking-biking trails in their plans. Unfortunately these facilities are frequently located in ways that increase environmental impacts by taking down more forest or intruding upon wetland buffers. Some localities have adopted a level of service analysis process for pedestrian facilities. CEDS routinely reviews plans to verify that safe, enjoyable walking-biking facilities are provided using routes that minimize impact without unduly sacrificing pedestrian pleasure and convenience.Property Value Loss
The best way to prevent traffic from causing a property value loss is to keep traffic volume low and. most importantly, avoid the use of a neighborhood street by heavy trucks, like dump trucks as opposed to parcel delivery vans.Sight Distance
This phrase refers to how far ahead a driver can see a stopped or approached vehicle. For example, while sitting at a stop sign you should be able to see a car approaching from the left or right about ten seconds before they arrive at your location. This allows sufficient time for you to turn onto the road without forcing the driver of the approaching vehicle to brake excessively. Sight distance increases with the speed of approaching vehicles. Generally you need about 11 feet of sight distance for every mile of posted speed limit plus 10. If the posted speed limit is 40 miles per hour then you must be able to see approaching vehicles when they are (40 mph + 10 = 50 x 11 = ) 550 feet distant. For proposed intersections sight distance should be measured at the point where a driver would be stopped with your eye about 3.5 feet above the ground surface. If a hill, vegetation or other objects block sight-distance then the developer usually has the option of removing the obstruction provided it is on their land or they can get the landowners permission. The primary reference used to determine sight distance is A Policy on Geometric Design of Highways and Streets. For simplified methods to assess sight-distance see: CEDS Traffic Evaluation Procedures.
Stopping Sight Distance
Scientific studies have shown that drivers require two- to four-seconds from the moment they see a hazard ahead to react by getting their foot on the brake pedal. Because of this two other sight distance measurements are used for vehicles approaching a proposed intersection. Braking Distance is the length of roadway needed for a vehicle to come to a full stop from the moment a driver’s foot is applied to the brake. Brake Reaction distance is the length of roadway needed to come to a full stop from the moment a drivers first sees a hazard. At 30 mph a vehicle will travel 110 feet from the moment a hazard is seen until the driver’s foot hits the brake. The vehicle will then travel another 86 feet before it comes to a full stop. This means that a car turning onto a road from a new intersection should be visible to approaching drivers at a distance of about 200 feet. At 50 mph the distance increases to 425 feet. Some localities only consider Braking Distance while the safer policy is to require that new intersections meet the Brake Reaction distance. The primary reference used to determine Brake Reaction and Braking Distance is A Policy on Geometric Design of Highways and Streets.Stop Sign Delay
As growth increases traffic volume area residents must wait for longer periods at stop signs. The Highway Capacity Manual provides the following criteria for rating delay Level Of Service (LOS). Delay is determined by counting the seconds each vehicle waits at a stop sign before turning or proceeding through an intersection. The measurement is made during that portion of the year, day of the week and hour of the day (peak-hour) with the highest traffic volume. The average delay is then computed for the peak-hour.
If the average, peak-hour delay is presently in the Level of Service “D” range of 26 to 35 seconds, then many local governments will require a developer to pay for improvements to prevent LOS from dropping to “E”. For simplified methods to assess stop sign delay see: CEDS Traffic Evaluation Procedures.
Delay is determined by counting the seconds each vehicle waits at a stop sign before turning or proceeding through an intersection. The measurement is made during that portion of the year, day of the week and hour of the day (peak-hour) with the highest traffic volume. The average delay is then computed for the peak-hour.
If the average, peak-hour delay is presently in the Level of Service “D” range of 26 to 35 seconds, then many local governments will require a developer to pay for improvements to prevent LOS from dropping to “E”. For simplified methods to assess stop sign delay see: CEDS Traffic Evaluation Procedures.
Street Width & Traffic Volume
Most new residential streets have a paved width of 20- to 24-feet. An exhibit in A Policy on Geometric Design of Highways and Streets recommends limits on traffic volume for narrower roads. Two-lane roads that are 18 feet in width should not have a traffic volume greater than 400 vehicles per day (vpd) nor a design speed greater than 40 mph. Roads 20 feet wide should not have a traffic volume greater than 1,500 vpd. At a width of 22 feet volume can range up to 2,000 vpd. With a width of 24 feet volume may exceed 2,000 vpd. A word of caution though. Many local traffic agencies have not adopted these volumes as limits. They are most likely to be applied to narrower roads – those 18 feet wide or less.Traffic Calming
As the phrase implies, traffic calming is intend to reduce both volume and speed. It is applied to neighborhood streets as well as downtown shopping areas with high volumes of pedestrian activity. Generally it consists of three approaches: education, structures and enforcement. Speed humps are the most recognizable form of traffic calming. Traffic calming measures can accident rates by 15% to 20% on residential streets. For inner-city parents of 5- to 10-year olds, 60% cite high traffic volume on their neighborhood streets as the reason why they would not let their children play outside. Speed humps and other structures that tend to be most effective. Education such as signs that flash your speed do reduce speed at first but the effect tends to diminish after a couple of weeks. Speed traps and other enforcement approaches are certainly effective but, again, the benefits dwindle over time. Even stop signs are viewed as relatively ineffective on low-volume roads where drivers routinely roll through. Structures such as speed humps slow traffic to 25 mph or less permanently. They cost about $6,000 each and are usually spaced 300- to 600-feet apart. However, it is claimed that fire departments tend to object to speed humps since they slow response time to emergencies. Another traffic calming measure for resolving cut-through traffic is road closure. If a proposed development project would add traffic to a neighborhood street then you could ask the developer to pick up the cost of installing calming measures. The net result could be a safer street since most neighborhoods tend to have a few idiot residents who insist upon racing to and from their home.Traffic Count Accuracy
An accurate count of traffic volume is key to determining Level Of Service discussed under Congestion above and the impact of a proposed development project. As such counts are central to the Traffic Impact Studies covered in the next section of this webpage. Traffic counts are best done with counters. When you see rubber tubes stretched across a road you’re seeing a traffic count underway. Counts are usually made for 48 hours during those times of the week and year when traffic volume tends to be highest. The 48 hours of data is then analyzed to determine the one-hour period with the highest traffic volume in the morning and evening. Usually the weekday peak-hour occurs between 7:00 – 9:00 am and 4:00 – 6:00 pm. Counts should be made in good weather on a school day. Never on a holiday. Generally Tuesday to Thursday is best. However, if you are in a resort area then counts must be made during the peak of the tourist season. But you do not need an expensive counter to determine traffic volume. Except for the highest volume roads you can do counts manually. Procedures for doing your own traffic count can be found at: CEDS Traffic Evaluation Procedures. And our clients have won a number of cases by showing that the applicant’s counts were well below actual traffic volumes.Traffic Impact Studies
Most local and state traffic-highway agencies will require a traffic impact study (TIS) for medium to large projects. A common threshold for a residential TIS is 50 homes or more. Your local traffic agency or state highway agency may have published minimum standards for traffic impact studies. Typically all intersections up to a mile from a proposed development site will be assessed or out to the first signalized intersection. Congestion is the focus of most studies. If the TIS shows that a development project may cause Level Of Service to drop below the minimum acceptable then the developer may propose improvements to resolve the issue. A number of intersection congestion issues can be resolved by adding a new turn lane or by adjusting signal timing. Unfortunately it pretty much takes a professional traffic engineer to evaluate the accuracy of a TIS. Fortunately CEDS has a number of traffic professionals within our network. In the previous section of this webpage we pointed out that traffic counts are one thing that citizens can do to assess TIS accuracy. If your counts show, say, 10% or more traffic then the developer’s study then you should make this know to the decision-makers responsible for reviewing the project. Also, compare the Trip Generation rate given in the TIS to that given in standard references or that you determine through your own studies. The estimate of project impact must factor in traffic from all other development proposals which are still under review but not built yet. Of course this would be projects that may contribute traffic to the same study points as the project which is the TIS focus. Finally, scrutinize the travel directions assumed in the TIS. Usually the direction will be mostly to and from major employers or employment centers in the region. If the TIS shows a large part of morning rush-hour traffic heading out into rural areas devoid of employers then this is a major flaw. For simplified methods to assess traffic study accuracy see: CEDS Traffic Evaluation Procedures.Traffic Signal Needed
A new development project may trigger a need to install a traffic signal. The triggering criteria are called “warrants” which are set forth in the Manual on Uniform Traffic Control Devices for Streets and Highways, published by the Federal Highway Administration. Assessing these warrants is complicated and requires the services a traffic professional. For assistance in finding a qualified professional contact CEDS at 410-654-3021 or Help@ceds.org.
Trip Generation
The Institute of Transportation Engineers publishes the primary reference on this topic: Trip Generation. This expensive tome contains trip generation rates for a large number of land uses. The table below gives a few examples. Generally about 11% of the daily trips will occur during the evening rush hour and 10% during the morning rush hour. Trip generation rates are usually given in vehicles per hour and refers to the rush-hour. For simplified methods to verify trip generation accuracy: CEDS Traffic Evaluation Procedures.
Turning Dead-End Streets Into Through-Roads
Except for very small projects, most local governments will require at least two means of access to and from a proposed development project. All too often though extending an existing cul-de-sac (dead-end street) is the means chosen by the developer to attain the second access. This causes those who live on the cul-de-sac considerable stress, particularly since they probably paid a premium to live on the low-volume street. But the motivation for a second access is frequently just for emergency vehicles. Frequently we can convince the developer and local officials to install a locked gate across the second access. This prevents anyone other than emergency services personnel from opening the gate and thereby keeps traffic volume low on the cul-de-sac. In fact it makes the cul-de-sac a bit safer by providing a second means of access. Before urging this and most other solutions CEDS always researches past decision-making history. This is part of our Smart Legal Strategies approach. This research tells us whether an alternative has been allowed and under what conditions, Plus we’re prepared for counter-arguments. To see an example of this research go to: Preventing Cul-De-Sacs From Becoming Through Roads. For further detail see: Neighborhood Streets & Cut-Through Traffic.Turning Gap
To safely turn onto a road there must be a sufficient gap between approaching vehicles. To make a left-hand turn onto a two-lane roads there needs to be a minimum gap of about six-seconds and a right requires four seconds. But the wider the road the greater the gap needed. One study showed that misjudging gap size accounted for 3.2% of all traffic accidents. Of course traffic flow is not uniform so drivers may need to wait as long as a minute or two for an adequate gap to appear on a busy road. Determining the average gap is not simple and requires an automatic counter along with the expertise of a professional traffic engineer, such as those in the CEDS network. As traffic volume increases frustrated drivers are tempted to turn with smaller gaps, which causes drivers on the main road to brake hard. This cycle lead to accident increases. Of course the gap needed for pedestrian and cyclist crossings is even greater. If gaps are insufficient for safety then a development project may be limited to right-in/right-out entrance. Right-In/Right-Out Entrance. Other options include installing a traffic signal at the new intersection.

Resolving Regional Traffic Issues
Far too many citizen advocates seek to prevent regional traffic congestion from getting worse by attempting to kill individual development projects. Generally this is doomed to fail. It’s also a waste of precious energy and funds. Instead, advocates should be putting their efforts into first determining if existing congestion-prevention laws are being fully enforced. If not or if you find that the laws are inadequate, then your effort should focus on improving enforcement or winning the adoption of better laws. This battle is best fought in a political arena, not in the courts. Political battles are far less expensive and citizens tend to have the advantage in this arena, whereas the development industry tends to win most of the time in the courts. Not to belabor the point, but consider this. In the Congestion section we said a single lane can accommodate about 1,460 vehicles per hour (vph) before dropping below a “D” level of service. Even a one-hundred house project would only add 110 vph – 7% increase. You might spend $5,000 to $50,000 trying to stop the project. But if your traffic congestion laws are poor then you’ll likely lose on this issue. But you could win better enforcement or improve the law throughout an entire town, city or county for less than $5,000. To understand the transportation planning process visit the U.S. Department of Transportation Every Place Counts: Leadership Academy website.Good Traffic Congestion Law
What does a good traffic congestion minimization law look like? Well, recall that Level Of Service was described in the Congestion section above. A good law would set the Level of Service standard at “C” or better for rural roads and “D” or better for suburban-urban roads. If a proposed development project would cause LOS to drop below the applicable standard then it could not be approved. But the law would allow for the developer to propose improvements. If the developers Traffic Impact Study showed the improvements would maintain LOS at the required minimum, then the project could be approved provided the developer was solidly locked into paying for and making the improvements through something like a public works agreement, proffers as well as permit conditions. If the local or state government plans to build a new road or expand existing streets and a solid commitment has been made to actually make the improvement then the project could be approved. Of course the improvements must resolve the congestion issue. Project development might be postponed until road improvements are underway or the project could be built in phases that coincide with increasing road capacity. If the improvements benefit mostly one or several projects, then the developers of these projects should pick up all costs.Does Your Area Have A Congestion Problem?
If it routinely takes more than one green cycle to get through more than a few signalized intersection in your town, city or county then congestion is certainly a problem. The same is true if it takes 50% to 100% longer to reach your destination at rush-hour (7-9 am; 4-6 pm) compared to say 10:00 am or 2:00 pm. Larger cities, metropolitan planning organizations or state transportation agencies routinely assess level of service at signalized intersections or along road-highway segments. To see if this information is available online for your area then try doing a search using the key words “level of service” plus the name of your town, city or county. If the search fails then try contacting the local traffic management office which is usually in a public works or planning agency. Next, click on metropolitan planning organizations to find the MPO for your area and contact their staff about the availability of congestion information. Try the same with your state transportation agency.Does Your Locality Have A Congestion Law
If your town, city or county has a law regarding traffic congestion then it will usually be found in a subdivision ordinance, development regulation, land use code and occasionally a zoning ordinance. Frequently these ordinances and regulations are available online. Usually you can reach them by searching on keywords like “code” + “name of your town, city or county”. You may also find links to these laws on the webpage for your local planning office. The law may be very specific setting forth the need and content of a traffic impact study along with level of service criteria. Or the law may be a more general one sentence requirement like: That adequate measures have been or will be taken to provide ingress or egress so designed as to minimize traffic congestion in public streets.If Yes, How Effective Is The Law
You are probably aware of recently approved medium to large development projects; 50 to 100 residential units. Were any located near intersections that you believe to be congested? If yes, ask your local planning-zoning office for an opportunity to review the project file. Does the file contain a traffic impact study or any other document regarding level of service? If yes, then did the study comply with the criteria given earlier in this webpage for Traffic Impact Studies. If the study showed the project would cause level of service to drop to an “E” or “F” did the developer propose measures that would resolve the congestion problem? If not and approval was granted then whatever existing law is on the books isn’t very effective or its not being enforced. If the file lacks a study then is there any other reference to congestion in the minutes or decision for the project? If not and you’re convinced a nearby intersection is excessively congested then existing law is, again, ineffective.Is The Law or Enforcement The Problem
If existing law meets the criteria presented above Good Traffic Congestion Law then you’re probably looking at an enforcement problem. This is definitely the case if local officials routinely approve development projects in close proximity to intersections that unequivocally suffer severe congestion.Improving Enforcement
While you might be tempted to initiate legal action to improve enforcement, DON’T DO THIS! A political strategy will be far more effective, far less costly and create a base from which you can gain more lasting benefits as well as go on to resolve other shortcomings in the way your locality manages growth. Similar campaigns managed by CEDS have brought about up to a 61% improvement in enforcement in a short period of time and at a cost of less than $3,000. Detailed guidance on how to execute such a campaign will be found in Chapter 36: Mobilizing Support For Your Strategy, Chapter 38: Working with Regulatory Staff and Chapter 39: Lobbying Final Decision-Makers in our free 300-page book How To Win Land Development Issues.Reducing Taxpayer Traffic Improvement Costs
Increasingly people resist paying the additional taxes needed to cover the cost of providing new roads, water and sewer services and schools required for new development. One option to generate additional funds for these and other infrastructure needs is to charge development companies an impact fee to cover the cost of road improvements. Impact fees are also assessed to cover the costs of building new schools, extending water-sewer lines and for other infrastructure needs. As of 2015, 29 states had passed legislation allowing local governments to charge impact fees. In 1987, Texas became the first to adopt this legislation. Following is a sampling of road-traffic related impacts fees. Some states and localities charge a transportation impact fee based on the amount of traffic a development project will generate. For example, the State of Pennsylvania charge $1,000 per peak-hour trip. In Western Washington State, 60 cities charge a peak-hour per trip fee of $515 to $8,462.
Winning Adoption Of A Better Law
We suggest beginning your search for a better law by contacting transportation, planning and legal experts at universities in your state. In all states there a few localities known for having the most effective laws and enforcement for growth issues like traffic, schools or environment. The university experts can quickly point you to these localities and may even serve as unbiased, low-cost advisors. You should not begin your search with independent or even government traffic engineers or other transportation officials. You will find it far easier to convince local decision-makers to adopt a law or an enforcement strategy which has been in use by other localities in your state. Being able to point to how well a proposed law works elsewhere makes it much more palatable. No one wants to be the first to try an untested law. Detailed guidance on how to succeed with this effort will be found in Chapter 41: Changing the Law in our free 300-page book How To Win Land Development Issues.Transportation & Land Use Planning
Resolving existing congestion and preventing future bottle-necks begins with land use and transportation planning. Most localities have a long-range (ten-year) master plan which may also be called a comprehensive plan, a general development plan, etc. To build a new major road it must first be included in the master plan. So the place to stop poorly planned new roads is at the master plan stage. A transportation plan may be a chapter in the master plan or a stand-alone document. A good master planning process will begin by identifying reasonable scenarios for how the locality can grow. The public would be provided with sufficient background so they can assess the pros and cons of each scenario. All residents of the locality would then have an opportunity to comment on each scenario. Through mechanisms like public opinion polls, focus groups, public hearings and committees the residents would select the most desirable scenario(s). The draft master plan would then set forth the changes needed to create conditions most likely to produce the preferred growth scenario. With regard to traffic congestion, the Land Use and Transportation chapters would show how growth could be directed to those areas with excess road capacity or where mass transit makes the most sense. The Capital Improvement chapter would give priority to using tax-dollars to resolve traffic congestion problems first and require developers to cover the cost of projects needed to accommodate growth. If your area is served by a Metropolitan Planning Organization then check out their documents for insights of traffic and transit opportunities.When Rural Main Street Is A Major Highway
Picture a four-lane highway with a posted speed limit of 55 mph or higher. You’ve been driving for a half-hour or so through corn fields, forest or desert passing scattered houses. You see a sign warning of reduced speed ahead alerting you that a more densely populated area is coming up. While most drivers slow, some do not. During peak traffic periods life can be difficult for those who live in the town as well as motorists trying to reach a remote destination. It may become impossible for residents to make a left-turn from their street or driveway! Pedestrians and cyclists alike may be risking their lives when attempting to cross the main street. Fortunately there are ways of improving such a situation but no panaceas. One Federal Highway Administration (FHWA) study recommended the use of traffic calming measures to alert motorists that the character of the highway is changing from rural to urban. These measures are described in the next section of this webpage. However, FHWA notes that while some towns have achieved a 15 mph reduction in speed with these measures, a 5 mph reduction is more typical. The good news is that all accidents were cut in half and those involving injury were cut by more than a fourth. Some towns have attempted to solve their main street traffic problems by building a bypass highway. But there truly is no such thing as a free lunch. Downtown business owners may then see a sharp drop in sales as former customers bypass the town. If responsible growth management is not in place and new shopping centers or big-box stores are allowed out near the bypass then the downtown businesses may begin failing. Uncontrolled growth out along the bypass may cause traffic volume to reach the point where out-of-town travelers begin using the main street to avoid bypass congestion.Neighborhood Traffic Calming
As the title implies, the goal of calming measures is to reduce the speed and volume of traffic on neighborhood streets. Many local and state governments have instituted programs to employ these measures, particularly on streets dominated by homes and carrying a high volume of cut-through traffic. Perhaps the most familiar example of a traffic calming measure is the speed hump, which can reduce average vehicle speed to 25 miles per hour or less. So why discuss Neighborhood Traffic Calming in a webpage devoted to proposed development? The folks who tend to be most concerned about the traffic impact of a development proposal are those currently suffering from excessive traffic. Calming measures can be used to resolve the existing problem. As stated above, conventional traffic impact analyses focus on congestion, not neighborhood street safety. Traffic congestion may not become an issue until traffic volume exceeds 15,000 vehicles per day (vpd) whereas neighborhood street safety concerns begin around 1,000 vpd and may become unmanageable at 4,000 vpd. This may provide you with an argument to convince a decision-making body not to allow a project to add traffic to your street if it causes volume to exceed the effective limits of calming measures. Finally, its not uncommon that the project developer can be convinced to cover the cost of traffic calming measures in exchange for citizens dropping their opposition to a project causing a small increase in traffic. The net result is a street that’s safer than it was before development.Traffic Calming Benefits
An American Journal of Public Health article provided the following best case for neighborhood traffic calming:Pedestrian injuries caused by automobile collisions are a leading cause of death among children aged 5 to 14 years. The demographic characteristics of children injured by automobiles have remained the same over the past 20 years, with boys, children between the ages of 5 and 9 years, and children living in neighborhoods of low socioeconomic status (SES) at highest risk.
A study by the AAA Foundation for Traffic Safety showed that reducing vehicle speed is crucial to reducing pedestrian injury and death. A pedestrian struck by a vehicle traveling 16 mph has a 10% chance of severe injury. At 23 mph the injury risk rises to 25% then 50% at 31 mph. The probability of death follows a similar pattern: 10% at 23 mph, 25% at 32 mph, and 50% at 42 mph. A Federal Highway Administration publication listed the following benefits of traffic calming:- The risk of serious injury or death is reduced;
- At the lower speeds achieved with calming measures a street feels more comfortable for walking and bicycling;
- Reduced noise and speed enhances property value;
- Because of lower speed and reduced traffic volume air quality improves;
- Crime is reduced because its more difficult to escape from a neighborhood with calming measures; and
- The landscaping included with many calming measures a neighborhood street gets greener, imparting a sense of being closer to nature.
How Much Traffic Is Too Much?
The Federal Highway Administration has adopted the following roadway classification system. With arterials, collectors and larger local streets congestion limits traffic volume; usually in excess of 1,500 vehicles per lane during the peak hour or 15,000 vehicles per day (vpd). With local streets, particularly those classified as secondary local or neighborhood streets, safety and other quality of life impacts should set volume limits. Most localities will not consider physical traffic calming measures until traffic volume exceeds 1,000 vpd. It appears that 4,000 vpd may be approaching the point where physical measures alone are not sufficient to preserve quality of life along a neighborhood street. Above 4,000 vpd traffic planners and engineers look at options for modifying road networks to limit travel on the neighborhood street. Other factors can lower the acceptable traffic volume level such as the absence of sidewalks and proximity to elementary schools.
Traffic Calming Measures
The goal of these measures is first to slow traffic speed then reduce excessive traffic volume. Both actions cause neighborhood streets to be safer to cross and less hazardous for children playing nearby. The following table summarizes the effectiveness of three categories of approaches for making neighborhood streets safer. Traffic calming is divided into three areas: education, enforcement and engineered measures. While all three are vital, only engineered measures provide lasting benefits. The following discussion is based mostly on the Center for Problem-Solving Policing webpage Responses to the Problem of Speeding in Residential Areas.
Education
These measures can range from a brochure to half-day programs given at local schools. Education must be the first step in any traffic calming effort. Before installing speed humps or other engineered measures on a neighborhood street it is essential that residents learn why they are needed. Residents must then have an opportunity to participate in decision-making about what approaches will be used. If done right most residents should support the effort.Enforcement
Police departments have found that enforcement can be effective if four criteria are met:- drivers believe it will occur;
- it has meaningful costs to offenders;
- police apply it generally, rather than at specific times and locations; and
- drivers are not tipped off by cues as to when it is or is not happening.
 Speed cameras can be effective while speed sign other measures, like the speed sign to the right only reduces speed for a few weeks. Every neighborhood seems to have a couple of residents who insist upon driving ridiculously fast. Most police departments will visit these individuals at home if alerted by other residents. This can be effective. Arresting the most severe offenders is quite effective but may require legislation giving police the authority to take this action.
Engineered Measures
These traffic calming measures range from safer crosswalks to closing off a street to through traffic. Speed Humps span both travel lanes and are typically two- or three-inches high. They reduce speed to 20 or 30 mph. They are easier to cross and more acceptable to emergency services than speed bumps.
Traffic Circles reduce mid-block speed by 10% and
Speed Humps span both travel lanes and are typically two- or three-inches high. They reduce speed to 20 or 30 mph. They are easier to cross and more acceptable to emergency services than speed bumps.
Traffic Circles reduce mid-block speed by 10% and intersection collisions by up to 70%. Roundabouts or rotaries are similar but are used where larger traffic volumes are anticipated and typically have two lanes of traffic in the circle. traffic circle
 Chicanes are installed mid-block to narrow a street or to impart gentle curves, but of which cause most drivers to slow-down. By narrowing the width of the street which must be crossed, chicanes also make it safer for pedestrians to cross.
Center Island Narrowing provide a safer
Chicanes are installed mid-block to narrow a street or to impart gentle curves, but of which cause most drivers to slow-down. By narrowing the width of the street which must be crossed, chicanes also make it safer for pedestrians to cross.
Center Island Narrowing provide a safer  crossing for pedestrians and can reduce speeds. Some emergency service agency find this the most acceptable calming measure. center island
If cut-through traffic becomes excessive on a narrow, neighborhood street then one option is to close the street off at one end. Simply making a street one-way can reduce cut-through traffic by half.
crossing for pedestrians and can reduce speeds. Some emergency service agency find this the most acceptable calming measure. center island
If cut-through traffic becomes excessive on a narrow, neighborhood street then one option is to close the street off at one end. Simply making a street one-way can reduce cut-through traffic by half.
Measures With Limited Effectiveness
The following measures have been found to have minimal impact upon speeding:- Reducing speed limits;
- Increasing fines and penalties;
- Stop signs; and
- Speed bumps (as opposed to humps) and rumble strips.
Traffic Calming Assistance
Determining what measures are appropriate for your street requires the assistance of a traffic engineer or other qualified professional. Many larger towns, cities and counties have a traffic calming programs where staff will assist neighborhoods in solving speeding-volume issues. These agencies may have the funds to install engineered measures, which can cost anywhere from $2,000 to $20,000 each. Usually traffic calming staff are in the local public works agency. Of course your local police department likely has an established program to assist you in making your street safer. A number of state highway agencies have traffic calming programs too. To get started try doing an internet search using the keywords of “traffic calming” + “name of your town, city, county”.Neighborhood Parking Problems
In 2007, the occupants of a typical US household had 2.07 vehicles which dropped to 1.8 by 2013. While 1.8 vehicles per household may not create a parking problem in a new suburban neighborhood, the paucity of spaces can be quite severe in older urban settings. And both neighborhoods may face parking shortfalls if development of adjacent lands occurs without adequate onsite parking. The parking dilemma is made more complex by competing interests such as stormwater pollution control where the goal is to minimize impervious surfaces like parking lots.
New Development & Adequate Parking
A proposal to develop a vacant tract of land next to your neighborhood may worsen or improve parking problems. If your neighborhood lacks adequate parking then you might negotiate an agreement with the developer to provide excess spaces adjacent to your neighborhood. If a vacant area exists within your neighborhood then the developer may agree to turn it into additional parking space. CEDS has found that most development companies will go to consider lengths – such as these examples – to gain the support of neighbors. You should find parking requirements in the zoning ordinance or other development regulations adopted by your local government. For example, many local planning and zoning agencies require a minimum of 2.0 parking spaces per single-family detached home. This ratio is based mostly upon a publication from the Institute of Transportation Engineers: Parking Generation, which is in its 4th edition and suggests parking ratios for 106 land uses (see examples in the table in the Parking section above). While ITE’s Parking Generation is the best reference we have, it should not be considered infallible. For some land uses the parking ratio may be based on only two or three studies nationwide, some of which are more than a decade old. Therefore CEDS always does a bit of research when evaluating a project. We contact those living next to existing examples of the same type of development in the same town, city or county. We ask these neighbors what positive and negative effects the development type has caused. One of our specific questions is how often parking overflows from the site. If the response is that overflow is something other than a rare occurrence then we can use this to document that the parking ratio is too low.Offsite Parking
Some land uses exhibit a very large range in parking needs. Religious facilities – mosques, temples, churches, synagogues, etc – are the classic example. On days when the congregation meets parking needs are at a maximum. The rest of the week the parking lot is mostly empty. This is a waste for several reasons. As stated in the Parking discussion above, each parking space costs $18,000. Each space also generates 7,000 gallons of polluted stormwater runoff a year. Within a mile of most of these facilities one can find parking lots vacant at times of worship. Examples include office parking lots, an empty park and ride lot, or even a shopping center lot where few of the spaces are occupied. Most shopping center lots are designed for peak buying in November-December with many spaces going empty at other times. A shuttle system could be used to transport folks from the satellite parking to the facility. I suspect many congregants would prefer car to door transportation, particularly the elderly.Residential Parking Permits
If your neighborhood is plagued by large numbers of nonresidents parking their cars, then a Residential Parking Permit program may be a solution. Through this program each household gets a fixed number of stickers to display on their vehicles. Depending upon how the program is structured, vehicles may be able to park along the street without a sticker during the day, but for no more than two-hours. Of course enforcement is the key to making the permit program work.Vision Zero
The Vision Zero website describes this concept as…“…a strategy to eliminate all traffic fatalities and severe injuries, while increasing safe, healthy, equitable mobility for all. First implemented in Sweden in the 1990s, Vision Zero has proved successful across Europe — and now it’s gaining momentum in major American cities.”
Vision Zero seeks to achieve this goal by…- “lowering speed limits
- redesigning streets,
- implementing meaningful behavior change campaigns, and
- enhancing data-driven traffic enforcement.”
If you’re concerned about how growth may affect traffic congestion and safety anywhere in the USA then contact CEDS at 410-654-3021 (call-text) or Help@ceds.org for an initial no-cost discussion of strategy options. Please don’t hesitate. Delay almost always decreases the likelihood of success.
Some car, truck, and bus traffic on neighborhood streets is a necessity given our current life style. However, this does not mean that these streets must accommodate an ever increasing amount of traffic. In fact, growth and traffic management agencies have an obligation to prevent traffic from reaching the point where it lowers quality of life or threatens public health and safety. Unfortunately, these agencies vary considerably across the nation with regard to their effectiveness in meeting this obligation. But this variation is due more to the amount of public support they receive and attitudes of elected officials.
Fortunately, citizen advocates have had great success in expanding public support, then getting responsible growth management candidates elected which translates into far more effective traffic management. This webpage is designed to show how you can accomplish the same whether your dealing with an individual development proposal or traffic issues throughout a town, city or county.
In this webpage we’ll describe:
- The ways in which excessive traffic can impact a neighborhood and the environment;
- How to prevent proposed development projects from causing congestion and other safety issues; and
- How your local and state government should be managing traffic on a regional scale.
Preventing Impacts Is Easy
We assume you’re visiting this webpage because you’re concerned about how a proposed development project may traffic on your neighborhood street, at your children’s school or where you work. If you are like most folks new to this form of advocacy you probably think its both difficult and expensive to prevent impacts. The good news is that its actually quite easy. And you probably don’t need a lawyer or any other professionals.
The reason is that its generally easy to modify most development proposals to utilize the highly-effective traffic management measures that have come into use over the past decade. And these measures can actually save the developer money. With your support the developer can probably gain approval from permitting agencies to use these measures.
We’ve found most development companies are anxious to work with citizens who have realistic solutions to potential impacts. We call this approach Equitable Solutions. We have a webpage devoted to the approach where you’ll find detailed advice on how to make it work for you: Equitable Solutions webpage.
Traffic Impacts
This section provides a description of the impacts commonly resulting from poorly managed growth. Options for preventing proposed development from causing these impacts is described in the next section: Preventing Traffic Impacts Caused By Proposed Development.
Accidents
According to the Centers for Disease Control & Prevention, nationwide motor vehicles accidents are:
- A leading cause of death;
- In 2012, more than 2.5 million drivers and passengers were treated in emergency rooms for injuries suffered in vehicle accidents; and
- Productivity losses and medical care costs due to traffic accidents total $80 billion annually.
The six most common causes of vehicle accidents are: distraction, fatigue, being under the influence, speeding, aggressive driving and weather. However, poorly planned growth can exacerbate accident rates by increasing congestion, which tends to cause some drivers to speed up and take more risks. Or a new intersection may be created at a point where motorists traveling on one road cannot see approaching vehicles in time to avoid a collision. Turning a dead-end (cul-de-sac) street into a through-road can cause traffic volume to increase many fold along with an increase in average vehicle speed, the result of which is an increase in both vehicle, pedestrian and cyclist accidents.
Air Quality & Health
A typical U.S. car emits enough pollution to create five tons of carbon dioxide a year. Cars and trucks produce half of all toxic air pollution emitted in the U.S. Estimates indicate that air pollution from cars results in 120,000 premature deaths each year in the U.S. Traffic generated air pollution also accounts for $40-$50 billion in health care costs each year in this country. In addition to these regional issues, some proposed development projects can create localized air quality problems. Locating a truck stop next to homes could create a health issue if diesel engines are idling for long periods. And whenever there is a large increase in truck traffic on a road lined with homes there will likely be an increase in the concentration of the particles emitted from diesel engines that account for most of the respiratory impact. There is some evidence indicating that those living within 600 feet of a major highway may be particularly at risk due air pollution. Large gas stations are another source but are addressed on the CEDS Convenience Stores & Gas Stations webpage.
Aquatic Resource Impacts
A new road can destroy aquatic resources when built upon a wetland, stream or other aquatic resource. One would think that this is no longer permitted, but that’s sadly not the case. Nationwide thousands of permits are issued annually allowing new development – particularly roads – to be built within waterways. But the greatest impact is the tremendous quantity of pollution washed from road surfaces with each storm. These pollutants include nutrients, sediment, and road salt along with a long list of toxic and even carcinogenic contaminants. A large portion of the pollution comes from vehicle exhaust as well as engine-body wear. Generally, as traffic volume increases the quantity of these pollutants increases as well. While these impacts can be greatly reduced they cannot be eliminated. This is why its vital that new roads be restricted where they may impact high-quality waters or highly-sensitive aquatic resources.
Noise, Health & Property Value
Traffic noise can interfere with sleep, conversation, and other neighborhood pursuits. About 9.5% of us are exposed to traffic noise at a level which affects health.
Sound becomes noise when it interferes with our quality of life. Sound is measured in units known as decibels (dB) and highway noise is measured on an “A-weighted decibel” (dBA) scale. 70 dBA is eight times as loud as 60 dBA. The noise level in a library might be 30 dBA while an air conditioner would emit 60 dBA.
Traffic volume, speed, and vehicle type all affect noise levels. At 2,000 vehicles per hour (vph) traffic noise will sound twice as loud as at 200 vph. Traffic moving at 65 mph will sound twice as loud as at 30 mph. And one truck traveling at 55 mph will sound as loud as 28 cars moving at the same speed.
Traffic noise can have a significant effect on property value. A home located adjacent to a major highway may sell for 8% to 10% less when compared to one located along a quiet neighborhood street. Heavy truck traffic lowers property value at a rate 150 times greater than cars. This is because at 50 feet heavy trucks emit noise at 90 dBA while a car traffic produces noise at a level of 50 dBA.5 An increase in heavy truck traffic may also cause damage to nearby homes through vibrations transmitted through the earth.
While some truck traffic is essential on neighborhood streets (e.g. refuse collection, delivery trucks, and fire engines) an increase in trucks passing through a neighborhood could lower property value and overall quality of life. Land uses that generate large amounts of truck traffic, such as mining, landfills or power plants, should be sited where there’s direct access to major highways; not residential streets.
Pedestrian & Cyclist Safety
In 2013, 4,735 pedestrians were killed in the U.S. by automobiles and 55% of these fatalities occurred on neighborhood streets. For every pedestrian killed by a car, another 15 were injured. Speed is a major factor determining whether a pedestrian will be killed or injured by an automobile. A pedestrian is nine times more likely to die if struck by a car traveling at 30 mph compared to 20 mph. Other factors contributing to the high pedestrian accident rate on neighborhood streets include lack of adequate sidewalks, bike lanes, and crossings.
Wasted Time
Traffic congestion is one of the most frustrating and costly symptoms of poorly regulated growth. Today a typical commuter spends an extra 42 hours traveling due to congestion which is up from 18 hours in 1982. Every weekday we spend 14.5 million hours stuck in congested traffic. That’s a lot of time spent unproductively. In 2014, the costs related to congestion totaled $160 billion nationally. And we wasted 3.1 billion gallons of fuel while stuck in congestion. While one often hears that new development is needed to bolster the local economy, it is rare to see the other side of the balance sheet showing for each dollar added how much is lost due to wasted time along with health impacts, reduced property value, etc. This issue is addressed in detail below under the heading Congestion & Economic Development.
Wildlife
New roads can harm wildlife if wetlands or waterways are destroyed, upland forests or other habitat is bulldozed away, barriers to fish and wildlife migrations are created and due to vehicle collisions with wildlife once the road is built. Of course pollutants washed from road surfaces also harms wildlife. Traffic noise also has a significant, negative effect on birds and mammals. Nationwide one- to two-million animals are killed on our roads annually.
Preventing Impacts from Proposed Development
A new housing project, office building or shopping center can increase congestion and delay, cause accident rates to increase or turn a once quiet neighborhood street into a noisy danger zone. Following is a brief description of the traffic related issues CEDS examines when reviewing a proposed development project. Through our Equitable Solutions and Smart Legal Strategy approach we resolve 90% of the issues we identify.
Adequate Public Facilities
An Adequate Public Facilities law restricts development when traffic congestion would exceed a specific threshold. An APF law is also known as concurrency requirements, a subdivision staging policy, growth policy, and by other labels.
To prevent excessive delay and an increase in traffic accidents the law must either:
- prohibit development that would exceed the threshold, or
- require the developer to make the road improvements needed to increase traffic capacity and drop congestion below the threshold.
Usually the threshold is defined by a Level Of Service standard. Level of Service (LOS) grades traffic congestion on a scale of A to F. Like school grades, A is best while F is gridlock. At an LOS of E you’ll spend two to four times longer in congested traffic compared to a D level of service. In suburban-urban areas an LOS of E-F is usually considered unacceptable. Development should be prohibited if it will add traffic to roads with an LOS of E or F. Growth should also be restricted if it would cause LOS to decline from D to E. However, some ultra-urban areas allow LOS to reach E before imposing development restrictions. In rural areas C may be the most severe congestion considered acceptable.
Many local governments lack a formal Adequate Public Facilities law but their zoning-subdivision regulations contain a requirement that development not cause an adverse effect on public safety. There are usually even more traffic-specific requirements. The requirements can be used to prevent excessive congestion in the same way as an Adequate Public Facilities law. Nevertheless, you may wish to consider calling for the adoption of the APF law, though this may require State authorizing legislation. For advice on changing the law see Chapter 41 in the free CEDS 300-page book How To Win Land Development Issues. For further information on Adequate Public Facility laws see:
- Adequate Public Facilities Ordinances: An Effective Land Use Tool for Local Governments in Georgia;
- Creating Effective Land Use Regulations through Concurrency;
- Concurrency: Levels of Service for Public Access; or
- Keeping a Foot in Each Camp: Adequate Public Facilities Ordinances as Both a Concurrency Tool and Means of Generating Revenue.
Aquatic Resource Impact Minimization
Traffic related impacts to wetlands, streams, rivers, lakes and tidal waters result from building new roads within 100 feet of these aquatic resources or from the pollutants washed from road surfaces by stormwater. Groundwater is another aquatic resource which can impacted by covering the land surface with asphalt, concrete or other impervious surfaces. These impervious materials prevent precipitation from soaking into the earth and recharging groundwater systems. But traffic pollutants can also be carried into adjoining soils and cause well contamination. Road salt is probably the best example of a traffic related polluted which has caused extensive ground and surface water contamination. With the exception of road salt, stormwater filtering-infiltration systems are highly effective in removing most pollutants from road runoff and maintaining groundwater recharge.
As shown in the graph above, some of the most effective systems are known as bioretention, micro-bioretention, dry swales or bio swales and other infiltration measures. An example of these highly effective systems is shown below. However, it is not uncommon for citizens to be deceived into thinking a proposed system is highly-effective when, in fact, it is not. It is vital that the system consist of the layers pictured below and that it be designed to treat the first inch of runoff from all impervious surfaces draining to it.
Keep in mind that even these highly-effective systems are not fool-proof and they can fail quickly if not well maintained. If a development site drains to highly-sensitive waters like those supporting threatened-endangered species or a public water supply, then its best to limit the amount of impervious surfaces in the watershed to less than 5% coverage. During the road construction phase it is very important that exposed soils be quickly protected from erosive forces with straw mulch, grass seeding and other temporary stabilization measures.
Congestion
Intersections with traffic signals and road segments are rated on a scale of A to F with regard to congestion. This system is known as Level Of Service or LOS. Most roads operate at a congestion-free “A” LOS during the wee hours of the morning. But LOS is based upon conditions during the morning (7:00 – 9:00 am) and evening (4:00 – 6:00 pm) rush-hours. An LOS of “E” and “F” is generally considered unacceptable. In fact an “F” LOS is gridlock.
Note two lanes of traffic in the photo to the left. Traffic flow in the left lane is typical of a C LOS while the right lane is operating at A or B. The above photo shows F or gridlock.
Most local and state traffic agencies will seek to prevent congestion from dropping below a “D” LOS for suburban-urban areas and “C” or better for rural roads. At an LOS of “E” you’ll spend two to four more time in congested traffic compared to a “D” level of service. In ultra urban settings traffic managers may have no choice but to allow LOS to drop to “E”. But at the high population density of these ultra-urban areas mass transportation becomes a viable a solution to preventing congestion from getting even worse. Most traffic officials and engineers rely upon the procedures set forth in the Highway Capacity Manual to assess Level Of Service. Unfortunately these procedures require a considerable amount of data and expertise to make an accurate assessment of LOS. However, some localities assume that LOS drops from “D” to “E” when any single lane has a volume greater than 1,460 vehicles per hour (vph), though the actual figure varies with design speed and other factors. Here are a couple of indicators of excessive congestion:
- During rush-hour it frequently takes two or more green cycles to get through an intersection with a traffic light; or
- It takes you twice as long to get to your destination during rush-hour compared to making the same trip at, say, 10:00 am or 2:00 pm.
For medium to large projects a traffic impact study is usually required. The TIS will employ far more sophisticated methods to accurately determine current and future Level of Service. The congestion LOS described in this paragraph is not appropriate for residential streets since it allows traffic far in excess of that which is conducive to a safe and enjoyable neighborhood atmosphere (see Neighborhood Streets & Traffic Volume below).
Congestion & Economic Development
In 2009, the Reason Foundation released a report on Gridlock and Growth. This study determined that severe congestion reduces economic health – expressed as Gross Regional Product – by 6% to 30%. Maintaining access to Central Business Districts (CBD) is particularly important. A 10% decrease in accessibility to a CBD can reduce recreational productivity by about 1%. But congestion around other common employment centers – suburbs, malls, universities and airports – can also reduces regional economic health. A University of Pennsylvania study documented that productivity growth slows when the annual hours of delay per commuter exceeds 39 hours. Another study indicated that employment growth slows due to greater difficulty in attracting works when congestion caused delay exceeds:
- 28- to 32-annual hours;
- when the average delay per one-way auto commute exceeds 4.5 minutes; or
- traffic volume on freeways and other limited access, high-speed roads exceeds 11,000 vehicle per lane day.
Collectively, this research indicates that the generally accepted belief that growth is always good for the economy may not necessarily be true if it occurs in a way that increases congestion in a town, city or county. To see the amount of delay for your area visit the Texas A&M Congestion Data website.
Cyclist Safety
The State of Florida has been leading the rest of the nation in developing criteria for allowing bicyclists and motor vehicles to share the road. The safest bike lanes are separated from traffic flow by a physical barrier, like a concrete wall.
There are actually procedures for rating Bicycling Level of Service based upon motor vehicle traffic volume, speed and bike lane configuration. A number of local governments require that new development projects not cause existing bike lanes to drop below a specific LOS. If they do then the applicant would have the option of covering the costs of bike lane improvements which would resolve the LOS conflict.
Dead-End Street Length
A dead-end street is also known as a cul-de-sac or a court. Some local development regulations contain a limit on the length of a dead-end street. The limit is prompted by concerns that homes located along the cul-de-sac may be cut-off from emergency services if the road is blocked by a fallen tree, a mudslide or floodwaters. The length limit is typically in the range of 1,000- to 2,000-feet. If such a limit is imposed in your area then the developer may be forced to find a second means of access or to cut proposed cul-de-sacs back to the limit. If you’re concerned about your dead-end street being converted then see Turning Dead-End Streets Into Through-Roads below.
Habitat Protection
Wetlands, streams, rivers, lakes, tidal waters and other aquatic habitats are best protected by maintaining a 100-foot buffer of native vegetation between the habitat and the limits of disturbance. To the extent possible, new roads should not pass through forest stands. Nor should they create more than a 300-foot break in migration corridors. For further detail see the FHWA Wildlife & Highways webpage.
High Accident Locations
If an intersection or road ranks among the most dangerous in an area then new development should not be allowed if it that would add more cars exacerbating accident rates. A number of cities, counties and states publish list of the 10 to 20 worst roads or intersections with regard to accidents. Following are a few examples:
If such a listing is not available for your area then frequently you can obtain accident (crash) data and do your own analysis. An example of a CEDS analysis of accident locations is posted at: Howard County, MD Neighborhood Streets Have Highest Accident Number.
If a proposed development project will add traffic to one of the most dangerous locations in your area then it should not be approved until the cause(s) have been corrected. If correction is not practical then approval should be denied.
Induced Traffic
A curious phenomenon, known as Induced Traffic, has been observed when a new road is opened in a congested area – traffic volume increases. The explanation offered is that motorists who used to stay home to avoid congestion make more trips by car once a new road relieves congestion. This is one of the many reasons why it is vitally important to carefully study every option for resolving congestion. In fact, a number of officials have concluded that its usually not possible to resolve congestion just by building new roads. This is particularly true when a new major road opens a rural area up for development.
Intersection Density
As the number of intersecting driveways, streets or other access points increases so does the probability of accidents. This relationship has been confirmed through studies conducted in Delaware, Illinois, Michigan, New Jersey, Oregon, Texas, Virginia and Wisconsin. This research showed that going from 10 access points per mile to 60 would triple the accident rate. Each additional access per mile of roadway increases the accident rate by about 4%.
Intersection Spacing
If a new street is proposed then it should intersect the existing road directly opposite an existing street. If this is not possible then the developer may be required to create the new intersection a minimum distance from existing intersections, such as say 300-feet. For further background see Driveway & Street Intersection Spacing.
Level of Service
Intersections with traffic signals and road segments are rated on a scale of A to F with regard to congestion. This system is known as Level Of Service or LOS. Most roads operate at a congestion-free “A” LOS during the wee hours of the morning. But LOS is based upon conditions during the morning (7:00 – 9:00 am) and evening (4:00 – 6:00 pm) rush-hours. An LOS of “E” and “F” is generally considered unacceptable. In fact an “F” LOS is gridlock.
Note two lanes of traffic in the photo to the left. Traffic flow in the left lane is typical of a C LOS while the right lane is operating at A or B. The above photo shows F or gridlock.
Most local and state traffic agencies will seek to prevent congestion from dropping below a “D” LOS for suburban-urban areas and “C” or better for rural roads. At an LOS of “E” you’ll spend two to four more time in congested traffic compared to a “D” level of service. In ultra urban settings traffic managers may have no choice but to allow LOS to drop to “E”. But at the high population density of these ultra-urban areas mass transportation becomes a viable a solution to preventing congestion from getting even worse. Most traffic officials and engineers rely upon the procedures set forth in the Highway Capacity Manual to assess Level Of Service. Unfortunately these procedures require a considerable amount of data and expertise to make an accurate assessment of LOS.
Some localities assume that LOS drops from “D” to “E” when any single lane has a volume greater than 1,460 vehicles during the peak-hour, though the actual figure varies with design speed and other factors. This approach is known as a Critical Movement Analysis or Critical Lane Analysis.
Here are a couple of indicators of excessive congestion:
- During rush-hour it frequently takes two or more green cycles to get through an intersection with a traffic light; or
- It takes you twice as long to get to your destination during rush-hour compared to making the same trip at, say, 10:00 am or 2:00 pm.
For medium to large projects a traffic impact study is usually required. The TIS will employ far more sophisticated methods to accurately determine current and future Level of Service. The congestion LOS described in this paragraph is not appropriate for residential streets since it allows traffic far in excess of that which is conducive to a safe and enjoyable neighborhood atmosphere (see Neighborhood Streets & Traffic Volume below).
Main Road Traffic & Neighborhood Streets
As congestion increases on main routes, commuters tend to use less crowded neighborhood through streets as a way around congested road segments. This action can greatly increase not only volume on the neighborhood street but average speed as well. Because of this CEDS traffic engineers will assess development proposals for the likelihood of increasing traffic on local streets even if the project access is onto a main road.
Neighborhood Streets & Traffic Volume
In the portion of this webpage on Congestion, above, it was stated that unacceptable conditions may not occur until a single lane is carrying more 1,460 vehicles per hour. Unfortunately, this same standard is the only one considered for neighborhood streets in far too many localities. Instead, one should look at the volumes which trigger the need for Traffic Calming measures such as speed humps.
Most traffic agencies use a threshold of 1,000- to 2,000-vehicles per day (vpd) before calming measures will be considered. This volume of traffic would be generated by 83 to 200 homes along a street. Proposed development projects should not cause traffic volume on an existing neighborhood street to exceed this volume. If it will then the developer should be required to cover the cost of installing calming measures. But even with calming measures traffic volume on a neighborhood street probably should not exceed 5,000 vpd. For further detail see: Neighborhood Streets & Cut-Through Traffic.
Noise Minimization
The best way to minimize noise on neighborhood streets is to keep traffic volume low. It is particularly important to prevent land uses that generate large volumes of truck traffic from being sited at locations where these heavy, noisy vehicles must travel neighborhood streets. Highway noise can be disturbing for those living up to a mile from a high-speed, limited access road. Noise barriers can reduce impacts for homes located within the noise shadow created by the barriers. Forest and noise fences tend not to be very effective.
Parking
This issue can be quite the two-edged sword if one lives near a site proposed for an intensive use and is concerned about aquatic resource impacts. On the one-hand too little parking on the intense use site means overflow parking may exhaust all the spaces on nearby streets. But creating excess parking at the site means far more impervious surfaces and a much greater volume of stormwater pollution. Residential parking permits is one option for protecting neighborhoods but effectiveness depends upon enforcement. The table below provides examples of the formulas used to estimate parking needs.
GFA in the table means Gross Floor Area and includes the surface area of all floors within a building, from basement to uppermost floor. A 2,500 square foot convenience store would require (2500 ÷ 1000 x 5.3 =) 13 parking spaces. While the standard reference is Parking Generation, many local governments have adopted their own formulas which appear in zoning, subdivision or land use regulations. And CEDS has occasionally succeeded in showing that a parking ratio is too low or high. In other words, you need not accept ratios as infallible. Megachurches and other uses will occasionally utilize off-site parking. Patrons are then bused from the off-site lot to their destination. This can be a good way to minimize parking lot size and stormwater runoff. But it may also be a way of shoehorning a use onto a site which is too small and inappropriate.
A typical space measures 9- by 18-feet or 162 square feet. But with turning lanes and other features, 290 square feet are needed to accommodate each vehicle parked in a lot. Parking spaces cost an average of $18,000 each to construct. One study indicated that it cost 67% more for spaces in an above-ground garage and 97% more for spaces created underground. Garages have a tremendous environmental benefit in generating far less stormwater pollution and requiring less habitat destruction.
Pedestrian Safety
Until recently our obsession with cars has resulted in vast areas where one literally risks their life trying to walk from one suburban location to another. Particularly disturbing is the absence of sidewalks for children to use in getting from their homes to school. Fortunately many local governments now require developers to include sidewalks and walking-biking trails in their plans. Unfortunately these facilities are frequently located in ways that increase environmental impacts by taking down more forest or intruding upon wetland buffers. Some localities have adopted a level of service analysis process for pedestrian facilities. CEDS routinely reviews plans to verify that safe, enjoyable walking-biking facilities are provided using routes that minimize impact without unduly sacrificing pedestrian pleasure and convenience.
Property Value Loss
The best way to prevent traffic from causing a property value loss is to keep traffic volume low and. most importantly, avoid the use of a neighborhood street by heavy trucks, like dump trucks as opposed to parcel delivery vans.
Sight Distance
This phrase refers to how far ahead a driver can see a stopped or approached vehicle. For example, while sitting at a stop sign you should be able to see a car approaching from the left or right about ten seconds before they arrive at your location.
This allows sufficient time for you to turn onto the road without forcing the driver of the approaching vehicle to brake excessively. Sight distance increases with the speed of approaching vehicles. Generally you need about 11 feet of sight distance for every mile of posted speed limit plus 10. If the posted speed limit is 40 miles per hour then you must be able to see approaching vehicles when they are (40 mph + 10 = 50 x 11 = ) 550 feet distant. For proposed intersections sight distance should be measured at the point where a driver would be stopped with your eye about 3.5 feet above the ground surface. If a hill, vegetation or other objects block sight-distance then the developer usually has the option of removing the obstruction provided it is on their land or they can get the landowners permission. The primary reference used to determine sight distance is A Policy on Geometric Design of Highways and Streets. For simplified methods to assess sight-distance see: CEDS Traffic Evaluation Procedures.
Stopping Sight Distance
Scientific studies have shown that drivers require two- to four-seconds from the moment they see a hazard ahead to react by getting their foot on the brake pedal. Because of this two other sight distance measurements are used for vehicles approaching a proposed intersection. Braking Distance is the length of roadway needed for a vehicle to come to a full stop from the moment a driver’s foot is applied to the brake. Brake Reaction distance is the length of roadway needed to come to a full stop from the moment a drivers first sees a hazard. At 30 mph a vehicle will travel 110 feet from the moment a hazard is seen until the driver’s foot hits the brake. The vehicle will then travel another 86 feet before it comes to a full stop. This means that a car turning onto a road from a new intersection should be visible to approaching drivers at a distance of about 200 feet. At 50 mph the distance increases to 425 feet. Some localities only consider Braking Distance while the safer policy is to require that new intersections meet the Brake Reaction distance. The primary reference used to determine Brake Reaction and Braking Distance is A Policy on Geometric Design of Highways and Streets.
Stop Sign Delay
As growth increases traffic volume area residents must wait for longer periods at stop signs. The Highway Capacity Manual provides the following criteria for rating delay Level Of Service (LOS).
Delay is determined by counting the seconds each vehicle waits at a stop sign before turning or proceeding through an intersection. The measurement is made during that portion of the year, day of the week and hour of the day (peak-hour) with the highest traffic volume. The average delay is then computed for the peak-hour.
If the average, peak-hour delay is presently in the Level of Service “D” range of 26 to 35 seconds, then many local governments will require a developer to pay for improvements to prevent LOS from dropping to “E”. For simplified methods to assess stop sign delay see: CEDS Traffic Evaluation Procedures.
Street Width & Traffic Volume
Most new residential streets have a paved width of 20- to 24-feet. An exhibit in A Policy on Geometric Design of Highways and Streets recommends limits on traffic volume for narrower roads. Two-lane roads that are 18 feet in width should not have a traffic volume greater than 400 vehicles per day (vpd) nor a design speed greater than 40 mph. Roads 20 feet wide should not have a traffic volume greater than 1,500 vpd. At a width of 22 feet volume can range up to 2,000 vpd. With a width of 24 feet volume may exceed 2,000 vpd. A word of caution though. Many local traffic agencies have not adopted these volumes as limits. They are most likely to be applied to narrower roads – those 18 feet wide or less.
Traffic Calming
As the phrase implies, traffic calming is intend to reduce both volume and speed. It is applied to neighborhood streets as well as downtown shopping areas with high volumes of pedestrian activity. Generally it consists of three approaches: education, structures and enforcement. Speed humps are the most recognizable form of traffic calming. Traffic calming measures can accident rates by 15% to 20% on residential streets. For inner-city parents of 5- to 10-year olds, 60% cite high traffic volume on their neighborhood streets as the reason why they would not let their children play outside.
Speed humps and other structures that tend to be most effective. Education such as signs that flash your speed do reduce speed at first but the effect tends to diminish after a couple of weeks. Speed traps and other enforcement approaches are certainly effective but, again, the benefits dwindle over time. Even stop signs are viewed as relatively ineffective on low-volume roads where drivers routinely roll through. Structures such as speed humps slow traffic to 25 mph or less permanently. They cost about $6,000 each and are usually spaced 300- to 600-feet apart. However, it is claimed that fire departments tend to object to speed humps since they slow response time to emergencies. Another traffic calming measure for resolving cut-through traffic is road closure. If a proposed development project would add traffic to a neighborhood street then you could ask the developer to pick up the cost of installing calming measures. The net result could be a safer street since most neighborhoods tend to have a few idiot residents who insist upon racing to and from their home.
Traffic Count Accuracy
An accurate count of traffic volume is key to determining Level Of Service discussed under Congestion above and the impact of a proposed development project. As such counts are central to the Traffic Impact Studies covered in the next section of this webpage. Traffic counts are best done with counters. When you see rubber tubes stretched across a road you’re seeing a traffic count underway. Counts are usually made for 48 hours during those times of the week and year when traffic volume tends to be highest. The 48 hours of data is then analyzed to determine the one-hour period with the highest traffic volume in the morning and evening. Usually the weekday peak-hour occurs between 7:00 – 9:00 am and 4:00 – 6:00 pm. Counts should be made in good weather on a school day. Never on a holiday. Generally Tuesday to Thursday is best. However, if you are in a resort area then counts must be made during the peak of the tourist season. But you do not need an expensive counter to determine traffic volume. Except for the highest volume roads you can do counts manually. Procedures for doing your own traffic count can be found at: CEDS Traffic Evaluation Procedures. And our clients have won a number of cases by showing that the applicant’s counts were well below actual traffic volumes.
Traffic Impact Studies
Most local and state traffic-highway agencies will require a traffic impact study (TIS) for medium to large projects. A common threshold for a residential TIS is 50 homes or more. Your local traffic agency or state highway agency may have published minimum standards for traffic impact studies. Typically all intersections up to a mile from a proposed development site will be assessed or out to the first signalized intersection. Congestion is the focus of most studies. If the TIS shows that a development project may cause Level Of Service to drop below the minimum acceptable then the developer may propose improvements to resolve the issue. A number of intersection congestion issues can be resolved by adding a new turn lane or by adjusting signal timing. Unfortunately it pretty much takes a professional traffic engineer to evaluate the accuracy of a TIS. Fortunately CEDS has a number of traffic professionals within our network. In the previous section of this webpage we pointed out that traffic counts are one thing that citizens can do to assess TIS accuracy. If your counts show, say, 10% or more traffic then the developer’s study then you should make this know to the decision-makers responsible for reviewing the project. Also, compare the Trip Generation rate given in the TIS to that given in standard references or that you determine through your own studies. The estimate of project impact must factor in traffic from all other development proposals which are still under review but not built yet. Of course this would be projects that may contribute traffic to the same study points as the project which is the TIS focus. Finally, scrutinize the travel directions assumed in the TIS. Usually the direction will be mostly to and from major employers or employment centers in the region. If the TIS shows a large part of morning rush-hour traffic heading out into rural areas devoid of employers then this is a major flaw. For simplified methods to assess traffic study accuracy see: CEDS Traffic Evaluation Procedures.
Traffic Signal Needed
A new development project may trigger a need to install a traffic signal. The triggering criteria are called “warrants” which are set forth in the Manual on Uniform Traffic Control Devices for Streets and Highways, published by the Federal Highway Administration.
Assessing these warrants is complicated and requires the services a traffic professional. For assistance in finding a qualified professional contact CEDS at 410-654-3021 or Help@ceds.org.
Trip Generation
The Institute of Transportation Engineers publishes the primary reference on this topic: Trip Generation. This expensive tome contains trip generation rates for a large number of land uses. The table below gives a few examples. A more complete table can be found at: Common Trip Generation Rates.
Generally about 11% of the daily trips will occur during the evening rush hour and 10% during the morning rush hour. Trip generation rates are usually given in vehicles per hour and refers to the rush-hour. For simplified methods to verify trip generation accuracy: CEDS Traffic Evaluation Procedures.
Turning Dead-End Streets Into Through-Roads
Except for very small projects, most local governments will require at least two means of access to and from a proposed development project. All too often though extending an existing cul-de-sac (dead-end street) is the means chosen by the developer to attain the second access. This causes those who live on the cul-de-sac considerable stress, particularly since they probably paid a premium to live on the low-volume street. But the motivation for a second access is frequently just for emergency vehicles. Frequently we can convince the developer and local officials to install a locked gate across the second access. This prevents anyone other than emergency services personnel from opening the gate and thereby keeps traffic volume low on the cul-de-sac. In fact it makes the cul-de-sac a bit safer by providing a second means of access. Before urging this and most other solutions CEDS always researches past decision-making history. This is part of our Smart Legal Strategies approach. This research tells us whether an alternative has been allowed and under what conditions, Plus we’re prepared for counter-arguments. To see an example of this research go to: Preventing Cul-De-Sacs From Becoming Through Roads. For further detail see: Neighborhood Streets & Cut-Through Traffic.
Turning Gap
To safely turn onto a road there must be a sufficient gap between approaching vehicles. To make a left-hand turn onto a two-lane roads there needs to be a minimum gap of about six-seconds and a right requires four seconds. But the wider the road the greater the gap needed.
One study showed that misjudging gap size accounted for 3.2% of all traffic accidents. Of course traffic flow is not uniform so drivers may need to wait as long as a minute or two for an adequate gap to appear on a busy road. Determining the average gap is not simple and requires an automatic counter along with the expertise of a professional traffic engineer, such as those in the CEDS network. As traffic volume increases frustrated drivers are tempted to turn with smaller gaps, which causes drivers on the main road to brake hard. This cycle lead to accident increases. Of course the gap needed for pedestrian and cyclist crossings is even greater. If gaps are insufficient for safety then a development project may be limited to right-in/right-out entrance. Right-In/Right-Out Entrance. Other options include installing a traffic signal at the new intersection.
Resolving Regional Traffic Issues
Far too many citizen advocates seek to prevent regional traffic congestion from getting worse by attempting to kill individual development projects. Generally this is doomed to fail. It’s also a waste of precious energy and funds. Instead, advocates should be putting their efforts into first determining if existing congestion-prevention laws are being fully enforced. If not or if you find that the laws are inadequate, then your effort should focus on improving enforcement or winning the adoption of better laws.
This battle is best fought in a political arena, not in the courts. Political battles are far less expensive and citizens tend to have the advantage in this arena, whereas the development industry tends to win most of the time in the courts.
Not to belabor the point, but consider this. In the Congestion section we said a single lane can accommodate about 1,460 vehicles per hour (vph) before dropping below a “D” level of service. Even a one-hundred house project would only add 110 vph – 7% increase. You might spend $5,000 to $50,000 trying to stop the project. But if your traffic congestion laws are poor then you’ll likely lose on this issue. But you could win better enforcement or improve the law throughout an entire town, city or county for less than $5,000.
To understand the transportation planning process visit the U.S. Department of Transportation Every Place Counts: Leadership Academy website.
Good Traffic Congestion Law
What does a good traffic congestion minimization law look like? Well, recall that Level Of Service was described in the Congestion section above. A good law would set the Level of Service standard at “C” or better for rural roads and “D” or better for suburban-urban roads. If a proposed development project would cause LOS to drop below the applicable standard then it could not be approved. But the law would allow for the developer to propose improvements.
If the developers Traffic Impact Study showed the improvements would maintain LOS at the required minimum, then the project could be approved provided the developer was solidly locked into paying for and making the improvements through something like a public works agreement, proffers as well as permit conditions. If the local or state government plans to build a new road or expand existing streets and a solid commitment has been made to actually make the improvement then the project could be approved. Of course the improvements must resolve the congestion issue. Project development might be postponed until road improvements are underway or the project could be built in phases that coincide with increasing road capacity. If the improvements benefit mostly one or several projects, then the developers of these projects should pick up all costs.
Does Your Area Have A Congestion Problem?
If it routinely takes more than one green cycle to get through more than a few signalized intersection in your town, city or county then congestion is certainly a problem. The same is true if it takes 50% to 100% longer to reach your destination at rush-hour (7-9 am; 4-6 pm) compared to say 10:00 am or 2:00 pm. Larger cities, metropolitan planning organizations or state transportation agencies routinely assess level of service at signalized intersections or along road-highway segments. To see if this information is available online for your area then try doing a search using the key words “level of service” plus the name of your town, city or county. If the search fails then try contacting the local traffic management office which is usually in a public works or planning agency. Next, click on metropolitan planning organizations to find the MPO for your area and contact their staff about the availability of congestion information. Try the same with your state transportation agency.
Does Your Locality Have A Congestion Law
If your town, city or county has a law regarding traffic congestion then it will usually be found in a subdivision ordinance, development regulation, land use code and occasionally a zoning ordinance. Frequently these ordinances and regulations are available online. Usually you can reach them by searching on keywords like “code” + “name of your town, city or county”. You may also find links to these laws on the webpage for your local planning office.
The law may be very specific setting forth the need and content of a traffic impact study along with level of service criteria. Or the law may be a more general one sentence requirement like:
That adequate measures have been or will be taken to provide ingress or egress so designed as to minimize traffic congestion in public streets.
If Yes, How Effective Is The Law
You are probably aware of recently approved medium to large development projects; 50 to 100 residential units. Were any located near intersections that you believe to be congested? If yes, ask your local planning-zoning office for an opportunity to review the project file. Does the file contain a traffic impact study or any other document regarding level of service? If yes, then did the study comply with the criteria given earlier in this webpage for Traffic Impact Studies. If the study showed the project would cause level of service to drop to an “E” or “F” did the developer propose measures that would resolve the congestion problem? If not and approval was granted then whatever existing law is on the books isn’t very effective or its not being enforced. If the file lacks a study then is there any other reference to congestion in the minutes or decision for the project? If not and you’re convinced a nearby intersection is excessively congested then existing law is, again, ineffective.
Is The Law or Enforcement The Problem
If existing law meets the criteria presented above Good Traffic Congestion Law then you’re probably looking at an enforcement problem. This is definitely the case if local officials routinely approve development projects in close proximity to intersections that unequivocally suffer severe congestion.
Improving Enforcement
While you might be tempted to initiate legal action to improve enforcement, DON’T DO THIS! A political strategy will be far more effective, far less costly and create a base from which you can gain more lasting benefits as well as go on to resolve other shortcomings in the way your locality manages growth. Similar campaigns managed by CEDS have brought about up to a 61% improvement in enforcement in a short period of time and at a cost of less than $3,000. Detailed guidance on how to execute such a campaign will be found in Chapter 36: Mobilizing Support For Your Strategy, Chapter 38: Working with Regulatory Staff and Chapter 39: Lobbying Final Decision-Makers in our free 300-page book How To Win Land Development Issues.
Reducing Taxpayer Traffic Improvement Costs
Increasingly people resist paying the additional taxes needed to cover the cost of providing new roads, water and sewer services and schools required for new development. One option to generate additional funds for these and other infrastructure needs is to charge development companies an impact fee to cover the cost of road improvements. Impact fees are also assessed to cover the costs of building new schools, extending water-sewer lines and for other infrastructure needs.
As of 2015, 29 states had passed legislation allowing local governments to charge impact fees. In 1987, Texas became the first to adopt this legislation. Following is a sampling of road-traffic related impacts fees.
Some states and localities charge a transportation impact fee based on the amount of traffic a development project will generate. For example, the State of Pennsylvania charge $1,000 per peak-hour trip. In Western Washington State, 60 cities charge a peak-hour per trip fee of $515 to $8,462.
Winning Adoption Of A Better Law
We suggest beginning your search for a better law by contacting transportation, planning and legal experts at universities in your state. In all states there a few localities known for having the most effective laws and enforcement for growth issues like traffic, schools or environment. The university experts can quickly point you to these localities and may even serve as unbiased, low-cost advisors. You should not begin your search with independent or even government traffic engineers or other transportation officials. You will find it far easier to convince local decision-makers to adopt a law or an enforcement strategy which has been in use by other localities in your state. Being able to point to how well a proposed law works elsewhere makes it much more palatable. No one wants to be the first to try an untested law. Detailed guidance on how to succeed with this effort will be found in Chapter 41: Changing the Law in our free 300-page book How To Win Land Development Issues.
Transportation & Land Use Planning
Resolving existing congestion and preventing future bottle-necks begins with land use and transportation planning. Most localities have a long-range (ten-year) master plan which may also be called a comprehensive plan, a general development plan, etc. To build a new major road it must first be included in the master plan. So the place to stop poorly planned new roads is at the master plan stage. A transportation plan may be a chapter in the master plan or a stand-alone document.
A good master planning process will begin by identifying reasonable scenarios for how the locality can grow. The public would be provided with sufficient background so they can assess the pros and cons of each scenario. All residents of the locality would then have an opportunity to comment on each scenario. Through mechanisms like public opinion polls, focus groups, public hearings and committees the residents would select the most desirable scenario(s).
The draft master plan would then set forth the changes needed to create conditions most likely to produce the preferred growth scenario. With regard to traffic congestion, the Land Use and Transportation chapters would show how growth could be directed to those areas with excess road capacity or where mass transit makes the most sense. The Capital Improvement chapter would give priority to using tax-dollars to resolve traffic congestion problems first and require developers to cover the cost of projects needed to accommodate growth. If your area is served by a Metropolitan Planning Organization then check out their documents for insights of traffic and transit opportunities. There are also a number of great mass transit advocacy groups anxious to support grass-roots advocates:
- NAPTA National Alliance of Public Transportation Advocates;
- Smart Growth Network; and
- Surface Transportation Policy Partnership.
When Rural Main Street Is A Major Highway
Picture a four-lane highway with a posted speed limit of 55 mph or higher. You’ve been driving for a half-hour or so through corn fields, forest or desert passing scattered houses. You see a sign warning of reduced speed ahead alerting you that a more densely populated area is coming up. While most drivers slow, some do not. During peak traffic periods life can be difficult for those who live in the town as well as motorists trying to reach a remote destination. It may become impossible for residents to make a left-turn from their street or driveway! Pedestrians and cyclists alike may be risking their lives when attempting to cross the main street. Fortunately there are ways of improving such a situation but no panaceas.
One Federal Highway Administration (FHWA) study recommended the use of traffic calming measures to alert motorists that the character of the highway is changing from rural to urban. These measures are described in the next section of this webpage. However, FHWA notes that while some towns have achieved a 15 mph reduction in speed with these measures, a 5 mph reduction is more typical. The good news is that all accidents were cut in half and those involving injury were cut by more than a fourth.
Some towns have attempted to solve their main street traffic problems by building a bypass highway. But there truly is no such thing as a free lunch. Downtown business owners may then see a sharp drop in sales as former customers bypass the town. If responsible growth management is not in place and new shopping centers or big-box stores are allowed out near the bypass then the downtown businesses may begin failing. Uncontrolled growth out along the bypass may cause traffic volume to reach the point where out-of-town travelers begin using the main street to avoid bypass congestion.
Neighborhood Traffic Calming
As the title implies, the goal of calming measures is to reduce the speed and volume of traffic on neighborhood streets. Many local and state governments have instituted programs to employ these measures, particularly on streets dominated by homes and carrying a high volume of cut-through traffic. Perhaps the most familiar example of a traffic calming measure is the speed hump, which can reduce average vehicle speed to 25 miles per hour or less.
So why discuss Neighborhood Traffic Calming in a webpage devoted to proposed development?
The folks who tend to be most concerned about the traffic impact of a development proposal are those currently suffering from excessive traffic. Calming measures can be used to resolve the existing problem.
As stated above, conventional traffic impact analyses focus on congestion, not neighborhood street safety. Traffic congestion may not become an issue until traffic volume exceeds 15,000 vehicles per day (vpd) whereas neighborhood street safety concerns begin around 1,000 vpd and may become unmanageable at 4,000 vpd. This may provide you with an argument to convince a decision-making body not to allow a project to add traffic to your street if it causes volume to exceed the effective limits of calming measures.
Finally, its not uncommon that the project developer can be convinced to cover the cost of traffic calming measures in exchange for citizens dropping their opposition to a project causing a small increase in traffic. The net result is a street that’s safer than it was before development.
Traffic Calming Benefits
An American Journal of Public Health article provided the following best case for neighborhood traffic calming:
Pedestrian injuries caused by automobile collisions are a leading cause of death among children aged 5 to 14 years. The demographic characteristics of children injured by automobiles have remained the same over the past 20 years, with boys, children between the ages of 5 and 9 years, and children living in neighborhoods of low socioeconomic status (SES) at highest risk.
A study by the AAA Foundation for Traffic Safety showed that reducing vehicle speed is crucial to reducing pedestrian injury and death. A pedestrian struck by a vehicle traveling 16 mph has a 10% chance of severe injury. At 23 mph the injury risk rises to 25% then 50% at 31 mph. The probability of death follows a similar pattern: 10% at 23 mph, 25% at 32 mph, and 50% at 42 mph.
A Federal Highway Administration publication listed the following benefits of traffic calming:
- The risk of serious injury or death is reduced;
- At the lower speeds achieved with calming measures a street feels more comfortable for walking and bicycling;
- Reduced noise and speed enhances property value;
- Because of lower speed and reduced traffic volume air quality improves;
- Crime is reduced because its more difficult to escape from a neighborhood with calming measures; and
- The landscaping included with many calming measures a neighborhood street gets greener, imparting a sense of being closer to nature.
A common concern about traffic calming measures is the effect they may have on emergency vehicle response time. But the FHWA publication cited above referenced studies in Berkley and Palo Alto, California where no effect on police, fire or ambulance response time was noted. Some localities deal with this issue by prohibiting the use of physical calming measures, like speed humps, on streets which are frequently used by emergency vehicles.
How Much Traffic Is Too Much?
The Federal Highway Administration has adopted the following roadway classification system.
With arterials, collectors and larger local streets congestion limits traffic volume; usually in excess of 1,500 vehicles per lane during the peak hour or 15,000 vehicles per day (vpd). With local streets, particularly those classified as secondary local or neighborhood streets, safety and other quality of life impacts should set volume limits. Most localities will not consider physical traffic calming measures until traffic volume exceeds 1,000 vpd. It appears that 4,000 vpd may be approaching the point where physical measures alone are not sufficient to preserve quality of life along a neighborhood street. Above 4,000 vpd traffic planners and engineers look at options for modifying road networks to limit travel on the neighborhood street. Other factors can lower the acceptable traffic volume level such as the absence of sidewalks and proximity to elementary schools.
Traffic Calming Measures
The goal of these measures is first to slow traffic speed then reduce excessive traffic volume. Both actions cause neighborhood streets to be safer to cross and less hazardous for children playing nearby. The following table summarizes the effectiveness of three categories of approaches for making neighborhood streets safer.
Traffic calming is divided into three areas: education, enforcement and engineered measures. While all three are vital, only engineered measures provide lasting benefits. The following discussion is based mostly on the Center for Problem-Solving Policing webpage Responses to the Problem of Speeding in Residential Areas. Other traffic calming resources can be found at:
Education
These measures can range from a brochure to half-day programs given at local schools. Education must be the first step in any traffic calming effort. Before installing speed humps or other engineered measures on a neighborhood street it is essential that residents learn why they are needed. Residents must then have an opportunity to participate in decision-making about what approaches will be used. If done right most residents should support the effort.
Enforcement
Police departments have found that enforcement can be effective if four criteria are met:
- drivers believe it will occur;
- it has meaningful costs to offenders;
- police apply it generally, rather than at specific times and locations; and
- drivers are not tipped off by cues as to when it is or is not happening.
Speed cameras can be effective while speed sign other measures, like the speed sign to the right only reduces speed for a few weeks. Every neighborhood seems to have a couple of residents who insist upon driving ridiculously fast. Most police departments will visit these individuals at home if alerted by other residents. This can be effective. Arresting the most severe offenders is quite effective but may require legislation giving police the authority to take this action.
Engineered Measures
These traffic calming measures range from safer crosswalks to closing off a street to through traffic.
Speed Humps span both travel lanes and are typically two- or three-inches high. They reduce speed to 20 or 30 mph. They are easier to cross and more acceptable to emergency services than speed bumps.
Traffic Circles reduce mid-block speed by 10% and intersection collisions by up to 70%. Roundabouts or rotaries are similar but are used where larger traffic volumes are anticipated and typically have two lanes of traffic in the circle. traffic circle
Chicanes are installed mid-block to narrow a street or to impart gentle curves, but of which cause most drivers to slow-down. By narrowing the width of the street which must be crossed, chicanes also make it safer for pedestrians to cross.
Center Island Narrowing provide a safer crossing for pedestrians and can reduce speeds. Some emergency service agency find this the most acceptable calming measure. center island
If cut-through traffic becomes excessive on a narrow, neighborhood street then one option is to close the street off at one end. Simply making a street one-way can reduce cut-through traffic by half.
Measures With Limited Effectiveness
The following measures have been found to have minimal impact upon speeding:
- Reducing speed limits;
- Increasing fines and penalties;
- Stop signs; and
- Speed bumps (as opposed to humps) and rumble strips.
Traffic Calming Assistance
Determining what measures are appropriate for your street requires the assistance of a traffic engineer or other qualified professional. Many larger towns, cities and counties have a traffic calming programs where staff will assist neighborhoods in solving speeding-volume issues. These agencies may have the funds to install engineered measures, which can cost anywhere from $2,000 to $20,000 each. Usually traffic calming staff are in the local public works agency. Of course your local police department likely has an established program to assist you in making your street safer. A number of state highway agencies have traffic calming programs too. To get started try doing an internet search using the keywords of “traffic calming” + “name of your town, city, county”.
Neighborhood Parking Problems
In 2007, the occupants of a typical US household had 2.07 vehicles which dropped to 1.8 by 2013. While 1.8 vehicles per household may not create a parking problem in a new suburban neighborhood, the paucity of spaces can be quite severe in older urban settings. And both neighborhoods may face parking shortfalls if development of adjacent lands occurs without adequate onsite parking. The parking dilemma is made more complex by competing interests such as stormwater pollution control where the goal is to minimize impervious surfaces like parking lots.
New Development & Adequate Parking
A proposal to develop a vacant tract of land next to your neighborhood may worsen or improve parking problems. If your neighborhood lacks adequate parking then you might negotiate an agreement with the developer to provide excess spaces adjacent to your neighborhood. If a vacant area exists within your neighborhood then the developer may agree to turn it into additional parking space. CEDS has found that most development companies will go to consider lengths – such as these examples – to gain the support of neighbors.
You should find parking requirements in the zoning ordinance or other development regulations adopted by your local government. For example, many local planning and zoning agencies require a minimum of 2.0 parking spaces per single-family detached home. This ratio is based mostly upon a publication from the Institute of Transportation Engineers: Parking Generation, which is in its 4th edition and suggests parking ratios for 106 land uses (see examples in the table in the Parking section above).
While ITE’s Parking Generation is the best reference we have, it should not be considered infallible. For some land uses the parking ratio may be based on only two or three studies nationwide, some of which are more than a decade old. Therefore CEDS always does a bit of research when evaluating a project.
We contact those living next to existing examples of the same type of development in the same town, city or county. We ask these neighbors what positive and negative effects the development type has caused. One of our specific questions is how often parking overflows from the site. If the response is that overflow is something other than a rare occurrence then we can use this to document that the parking ratio is too low.
Offsite Parking
Some land uses exhibit a very large range in parking needs. Religious facilities – mosques, temples, churches, synagogues, etc – are the classic example. On days when the congregation meets parking needs are at a maximum. The rest of the week the parking lot is mostly empty. This is a waste for several reasons. As stated in the Parking discussion above, each parking space costs $18,000. Each space also generates 7,000 gallons of polluted stormwater runoff a year. Within a mile of most of these facilities one can find parking lots vacant at times of worship. Examples include office parking lots, an empty park and ride lot, or even a shopping center lot where few of the spaces are occupied. Most shopping center lots are designed for peak buying in November-December with many spaces going empty at other times. A shuttle system could be used to transport folks from the satellite parking to the facility. I suspect many congregants would prefer car to door transportation, particularly the elderly.
Residential Parking Permits
If your neighborhood is plagued by large numbers of nonresidents parking their cars, then a Residential Parking Permit program may be a solution. Through this program each household gets a fixed number of stickers to display on their vehicles. Depending upon how the program is structured, vehicles may be able to park along the street without a sticker during the day, but for no more than two-hours. Of course enforcement is the key to making the permit program work.
Vision Zero
The Vision Zero website describes this concept as…
“…a strategy to eliminate all traffic fatalities and severe injuries, while increasing safe, healthy, equitable mobility for all. First implemented in Sweden in the 1990s, Vision Zero has proved successful across Europe — and now it’s gaining momentum in major American cities.”
Vision Zero seeks to achieve this goal by…
- “lowering speed limits
- redesigning streets,
- implementing meaningful behavior change campaigns, and
- enhancing data-driven traffic enforcement.”
Consider urging your local elected officials to adopt a Vision Zero plan for your village, borough, town, city or county. For further detail visit the Vision Zero resources page at: https://visionzeronetwork.org/resources/